RCEE+Networks LLC
  • Home
  • About
  • Services
    • IMACAM™ Tech Support
  • Products
    • RetinaWiseAI™
  • Contact
1-844-2-THEOWL
info@rceenetworks.com
logotype
  • Home
  • About
  • Services
    • IMACAM™ Tech Support
  • Products
    • RetinaWiseAI™
  • Contact
logotype
  • Home
  • About
  • Services
    • IMACAM™ Tech Support
  • Products
    • RetinaWiseAI™
  • Contact
Uncategorized
Home Uncategorized Page 13

Category: Uncategorized

Uncategorized
Umesh Kumar KhiriMarch 6, 2026 0 Comments
Share article:TwitterFacebookLinkedin
46 Views
8 Likes

Debugging Web Services: 7 Essential Methods for Reliable API Performance

Debugging web services refers to the process of detecting, analyzing, and resolving errors that occur when applications communicate through APIs or service endpoints. It involves examining request–response cycles, server logs, authentication flows, and network interactions. Proper debugging ensures web services function correctly across distributed systems and prevents failures that may affect application performance or data integrity.

Key Takeaways

  • Debugging web services identifies and resolves API communication errors.
  • The process involves analyzing requests, responses, and server logs.
  • Tools like Postman, Visual Studio, and network analyzers support troubleshooting.
  • Structured debugging steps help isolate and fix service failures efficiently.
  • Effective debugging improves system reliability and integration performance.

What Is Debugging Web Services and Why Is It Important?

Debugging web services focuses on identifying faults in API communication between applications. These issues often occur during request processing, data serialization, authentication, or network transmission.

Common debugging targets include:

  • API endpoint failures
  • Invalid request parameters
  • Authentication or authorization errors
  • Timeout or network connectivity problems
  • Data format inconsistencies (JSON or XML)

Typical debugging workflow:

StageDescription
DetectionIdentify service errors or unexpected responses
IsolationDetermine which endpoint or component caused the issue
AnalysisExamine logs, stack traces, or request payloads
ResolutionModify code or configuration
ValidationTest the corrected service

Without systematic debugging, service integrations may produce unstable or inconsistent application behavior.

How Does Debugging Web Services Work in Practice?

Debugging web services works by inspecting the communication flow between a client application and a service endpoint.

Key diagnostic techniques include:

1. Request Inspection

  • Analyze HTTP methods (GET, POST, PUT, DELETE)
  • Verify headers, parameters, and authentication tokens

2. Response Analysis

  • Check status codes (200, 404, 500)
  • Validate response body format

3. Log Monitoring

  • Server logs reveal execution errors and exceptions

4. Breakpoint Debugging

  • Developers pause execution within service logic

Example debugging scenario:

IssueDebugging Action
401 UnauthorizedVerify authentication tokens
500 Internal Server ErrorInspect server stack trace
Timeout errorEvaluate network latency or service load

Which Tools Are Commonly Used for Debugging Web Services?

Developers rely on specialized tools that capture and analyze service communication.

Common debugging tools include:

API Testing Tools

  • Postman
  • SoapUI
  • Insomnia

Development Environment Debuggers

  • Visual Studio debugging tools
  • Eclipse debugging utilities
  • IntelliJ IDEA debugger

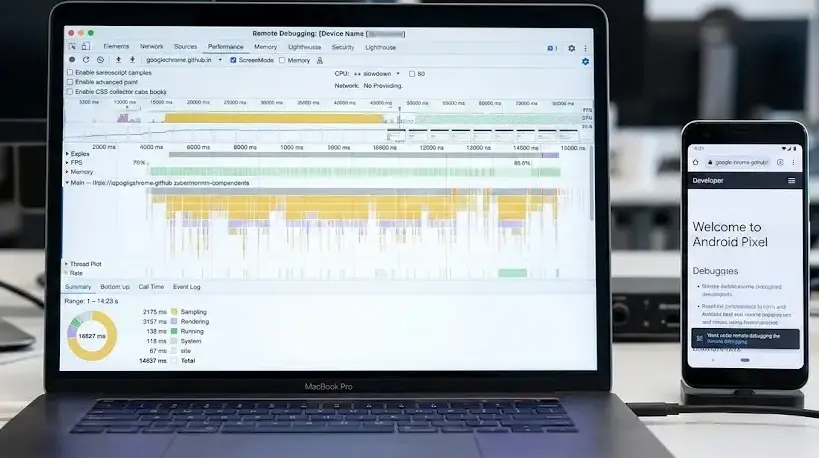
Network Monitoring Tools

  • Wireshark
  • Fiddler
  • Browser developer tools

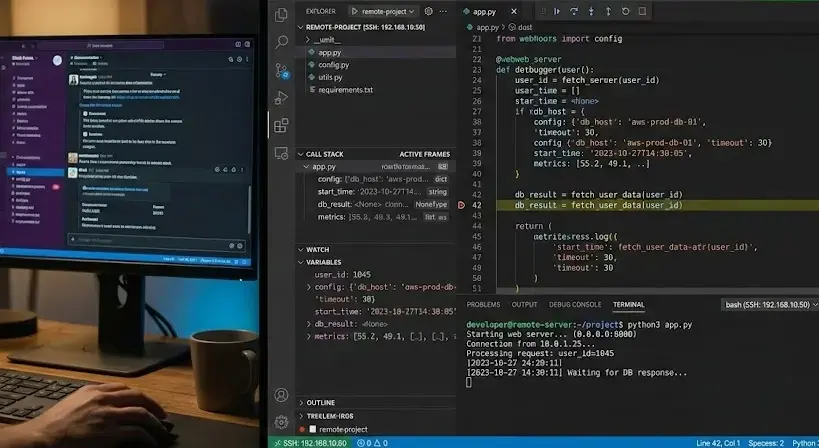
For example, Visual Studio debugging web services allows developers to set breakpoints in API controllers and inspect variables during runtime.

Many developers studying what is debugging in programming, the debugging process, or debugging examples encounter these tools when learning how to do debugging effectively.

What Are the Most Common Web Service Errors?

Web service failures usually originate from configuration mistakes, code defects, or infrastructure limitations.

Typical error categories include:

Error TypeDescription
Authentication FailureInvalid API keys or tokens
Data Format ErrorIncorrect JSON or XML structure
Endpoint MisconfigurationIncorrect service URL
Network FailureDNS or connectivity problems
Server ExceptionApplication logic error

Example:

HTTP 500 Internal Server Error

This response usually indicates a server-side exception that must be traced using logs or a debugger.

What Are the Standard Steps for Debugging Web Services?

Industry debugging practices follow a structured sequence to prevent incomplete troubleshooting.

Seven common debugging steps:

  1. Reproduce the error consistently
  2. Inspect API requests and responses
  3. Check service logs and error messages
  4. Use breakpoints in service code
  5. Validate configuration settings
  6. Apply fixes and run integration tests
  7. Confirm the issue no longer occurs

This structured debugging process improves reliability in distributed service environments.

How Can Developers Improve Web Service Debugging Efficiency?

Efficient debugging requires disciplined testing and monitoring strategies.

Recommended practices:

  • Implement detailed logging for service endpoints
  • Use automated API testing tools
  • Validate input parameters before processing
  • Monitor API performance metrics
  • Maintain versioned API documentation

Some related topics commonly explored alongside this subject include debugging tools, debugging examples, what is debugging in C, and how to learn debugging when studying broader software troubleshooting practices.

Conclusion

Debugging web services is a structured diagnostic practice that ensures reliable communication between distributed applications. By combining logging, debugging tools, and standardized testing steps, developers can isolate faults and maintain stable API integrations.

Understanding these practices also complements broader software troubleshooting topics, including What are professional software debugging services, which examine structured debugging support within professional development environments.

FAQ

How to debug a web service?

Debug a web service by inspecting API requests, analyzing server logs, setting breakpoints in code, and validating service responses.

Which IDE is best for debugging?

Popular IDEs for debugging include Visual Studio, IntelliJ IDEA, and Eclipse because they support breakpoints, variable inspection, and step execution.

What are the 7 debugging steps?

The seven debugging steps are reproducing the error, inspecting requests, checking logs, setting breakpoints, validating configuration, applying fixes, and verifying results.

What is debugging in web technology?

Debugging in web technology is the process of identifying and fixing issues in web applications, APIs, and server communication layers.

What is debugging in programming?

Debugging in programming is the systematic identification and correction of errors in software code that cause incorrect behavior or failures.

Sources

https://aws.amazon.com/what-is/debugging/
https://www.ibm.com/docs/en/imdm/11.6.0?topic=services-debugging-web
https://stackoverflow.com/questions/12581932/how-to-debug-web-service
https://download.oracle.com/otn_hosted_doc/jdeveloper/1012/web_services/deb_wsabout.html
https://yupingohanga.medium.com/starting-the-debugger-for-web-services-in-node-52a294e6d99c
https://www.ni.com/docs/en-US/bundle/labview/page/testing-and-debugging-a-web-service-on-the-application-web-server-real-time-windows.html?srsltid=AfmBOoouhCGSYkK13g96B0wQ5KnCGHmw-fsSIW-SHoa1D3E_6Yx8-y6v
https://arquiconsult.com/en/debug-attach/
https://mybusinesscentraldiary.wordpress.com/2020/04/25/debugging-web-services-in-saas/
https://techdocs.audiocodes.com/session-border-controller-sbc/mp-1288/user-manual/version-740/Content/UM/Debugging%20Web%20Services.htm

READ MORE
Uncategorized
Umesh Kumar KhiriMarch 6, 2026 0 Comments
Share article:TwitterFacebookLinkedin
48 Views
8 Likes

What Are Professional Software Debugging Services: 7 Essential Capabilities Explained

What are professional software debugging services? Professional software debugging services are specialized technical solutions used to identify, diagnose, and fix defects or logical errors in software applications. These services are commonly provided by experienced developers or engineering teams to maintain application stability, security, and performance. By systematically analyzing code behavior and runtime conditions, debugging services help organizations reduce downtime, prevent software failures, and ensure reliable digital systems.

Key Takeaways

  • Professional software debugging services identify and fix defects in software systems.
  • These services involve structured processes such as error detection, isolation, and validation.
  • Static and dynamic debugging are the two primary methods used in development.
  • Specialized debugging tools support multiple programming languages and environments.
  • Effective debugging improves reliability, security, and software performance.

What Are Professional Software Debugging Services and How Do They Work?

Professional software debugging services involve systematic processes used to locate and resolve defects in source code or application behavior. These services rely on diagnostic tools, testing environments, and experienced engineers.

Typical debugging activities include:

  • Code inspection: Reviewing source code to identify logical errors
  • Runtime analysis: Monitoring software behavior during execution
  • Error replication: Reproducing bugs in controlled environments
  • Patch development: Creating code fixes to remove defects
  • Regression testing: Ensuring fixes do not introduce new issues

Example workflow:

StepActivityPurpose
1Error detectionIdentify abnormal behavior
2Bug isolationLocate the exact source of the defect
3Code correctionModify logic or structure
4ValidationTest the solution
5DeploymentApply the fix to production systems

Industries such as fintech, healthcare software, and enterprise SaaS rely on these services to maintain system integrity.

Why Are Professional Software Debugging Services Important in Programming?

Professional software debugging services play a critical role in maintaining functional and secure applications.

Key reasons they are essential include:

  • Improving software reliability: Removing defects prevents crashes or malfunction
  • Enhancing security: Debugging identifies vulnerabilities that attackers could exploit
  • Maintaining performance: Resolving inefficient code improves execution speed
  • Supporting compliance: Software systems must meet technical standards in regulated sectors

For example, financial software platforms require stable transaction processing systems where debugging ensures accuracy and prevents operational disruptions.

What Types of Professional Software Debugging Services Exist?

Professional debugging services are typically categorized based on how errors are analyzed.

1. Static Debugging

  • Analysis performed without executing the program
  • Focuses on code reviews and automated analysis tools

2. Dynamic Debugging

  • Performed during program execution
  • Observes runtime behavior and memory usage

Additional debugging approaches include:

  • Remote debugging: Engineers troubleshoot software running on external servers
  • Post-mortem debugging: Analysis performed after system crashes
  • Performance debugging: Identifies inefficiencies affecting speed or scalability

These methods help engineers diagnose complex system failures in distributed or cloud-based environments.

What Tools Are Used in Professional Software Debugging Services?

Professional debugging services rely on specialized development tools and environments.

Common debugging tools include:

ToolPrimary Use
GDB (GNU Debugger)Debugging C and C++ programs
Visual Studio DebuggerIntegrated debugging for .NET and Windows applications
PyCharm DebuggerPython application debugging
Chrome DevToolsDebugging JavaScript in web applications
LLDBLow-level debugging for compiled languages

Many organizations also integrate debugging tools with automated testing pipelines to detect issues early in development.

How Do Professional Software Debugging Services Apply to Programming Languages?

Professional software debugging services are used across multiple programming languages and development environments.

Examples include:

Debugging in Python

  • Tools such as pdb allow step-by-step code execution
  • Developers inspect variables and program flow

Debugging in web development

  • JavaScript debugging with browser developer tools
  • Identifying DOM errors or asynchronous issues

Debugging in enterprise systems

  • Monitoring distributed microservices
  • Analyzing API failures and server logs

Many readers exploring debugging services also review related concepts such as debugging software tools, debugging in programming examples, and different types of debugging methods used in development environments.

What Examples Illustrate Professional Software Debugging Services?

Professional debugging services can be applied in many technical scenarios.

Examples include:

  • E-commerce platform bug fix: Resolving checkout calculation errors
  • Mobile app crash analysis: Identifying memory leaks in Android applications
  • Cloud infrastructure troubleshooting: Diagnosing API failures in microservices
  • Database debugging: Fixing slow query execution affecting system performance

These services often combine automated testing, logging systems, and manual engineering expertise to resolve issues efficiently.

Conclusion

Professional software debugging services provide structured methods for detecting and correcting errors in software systems, ensuring reliable operation across industries. By applying systematic analysis techniques and specialized tools, organizations maintain application quality and operational stability. For a deeper understanding of provider selection criteria, review “How to choose a debugging service provider.”

FAQ

What are the two types of debugging?

The two main types are static debugging, which analyzes code without running it, and dynamic debugging, which examines software during execution.

What is software debugging?

Software debugging is the process of identifying, analyzing, and fixing errors or defects in computer programs.

Which software is used for debugging?

Common debugging software includes GDB, Visual Studio Debugger, PyCharm Debugger, Chrome DevTools, and LLDB.

What are the 7 debugging steps?

Common debugging software includes GDB, Visual Studio Debugger, PyCharm Debugger, Chrome DevTools, and LLDB.

Why is debugging important in programming?

Debugging ensures software functions correctly, prevents system crashes, improves performance, and reduces security risks.

Sources

https://www.sonarsource.com/resources/library/debugging/
https://www.theknowledgeacademy.com/blog/what-is-debugging/
https://www.ibm.com/think/topics/debugging
https://www.coursera.org/in/articles/what-is-debugging
https://www.linkedin.com/pulse/what-debugging-software-uses-how-works-svvbe/
https://www.globedetective.com/tscm-services/
https://aws.amazon.com/what-is/debugging/
https://jetruby.com/blog/debugging-in-software-development-process/
https://www.disher.com/blog/software-debugging-strategies/
https://www.janbasktraining.com/blog/debugging-guide-importance-challenges-strategies/

READ MORE
Uncategorized
Umesh Kumar KhiriMarch 6, 2026 0 Comments
Share article:TwitterFacebookLinkedin
50 Views
9 Likes

How to Choose a Debugging Service Provider: 7 Powerful Tips for Selecting the Best Technical Experts

How to choose a debugging service provider refers to the process of assessing technical capability, tools, processes, and service reliability before outsourcing debugging tasks. Debugging providers analyze software defects, runtime failures, or performance issues across applications, services, and infrastructure. Selecting a qualified provider ensures efficient troubleshooting, secure code handling, and consistent system performance across platforms such as Android, JavaScript environments, and Windows service applications.

Key Takeaways

  • Choosing a debugging provider requires evaluating expertise, tools, and operational processes.
  • Professional debugging relies on logs, monitoring systems, and structured diagnostic methods.
  • Tools such as WinDbg, IDE debuggers, and cloud monitoring platforms improve troubleshooting efficiency.
  • Service providers must ensure strong security practices and documented debugging workflows.
  • Proper provider selection reduces downtime and improves software reliability.

What technical expertise should a debugging service provider demonstrate?

When evaluating how to choose a debugging service provider, the first factor is the provider’s technical specialization and experience across programming environments.

Key expertise areas include:

  • Programming languages: JavaScript, C#, Python, Java
  • Platforms: Android debugging environments, Windows services, cloud applications
  • Service-based architectures: microservices and API debugging
  • Enterprise systems: SAP, ServiceNow, and distributed systems

Examples of technical capabilities:

Technology AreaExample Debugging Tasks
Android servicesDebugging background processes or device logs
JavaScript applicationsResolving runtime errors or async failures
Windows servicesDiagnosing service crashes or startup failures
Cloud platformsMonitoring and debugging service latency

Providers should also demonstrate familiarity with enterprise debugging workflows and production troubleshooting.

Which debugging tools and diagnostic platforms should providers use?

Understanding how to choose a debugging service provider requires examining the tools they use to analyze and resolve software defects.

Common professional debugging tools include:

  • WinDbg for low-level Windows debugging
  • Integrated development environment (IDE) debuggers such as Visual Studio
  • Android debugging tools for mobile services
  • Cloud monitoring platforms for distributed applications

Important diagnostic capabilities:

  • Memory dump analysis
  • Service log inspection (for example, Microsoft service logs)
  • Performance monitoring
  • Breakpoint and trace debugging

Advanced providers often integrate automated monitoring and error tracking systems to detect issues before they affect users.

How can service logs and monitoring systems improve debugging accuracy?

When studying how to choose a debugging service provider, it is important to evaluate how the provider handles logs and diagnostic data.

Reliable debugging services typically analyze:

  • Windows service logs
  • Application runtime logs
  • System event logs
  • Custom log outputs (e.g., C# Windows service write-to-log-file functions)

Example workflow:

  1. Identify the failure event in system logs
  2. Trace execution paths in the code
  3. Analyze service dependencies
  4. Reproduce the error in a controlled environment

Structured logging significantly accelerates root-cause analysis.

What service models and support structures should providers offer?

Another factor in how to choose a debugging service provider is the service delivery model.

Common service models include:

  • On-demand debugging support
  • Dedicated debugging teams
  • Managed application monitoring
  • Incident-response debugging services

Key evaluation criteria:

  • Response time commitments
  • Availability for production incidents
  • Secure code handling procedures
  • Clear documentation of fixes

Organizations often compare debugging providers alongside software maintenance services, outsourced development support, and cloud monitoring solutions.How should providers handle Windows and enterprise service debugging?

Organizations working with Windows infrastructure must evaluate how to choose a debugging service provider capable of diagnosing service-level issues.

Typical enterprise debugging scenarios include:

  • Windows service startup failures
  • Service wrapper configuration issues
  • Reinstallation or recovery of corrupted services
  • Debugging background processes

Example troubleshooting process:

StepAction
1Verify service configuration
2Check Windows service logs
3Attach debugger to service process
4Inspect memory dumps
5Validate dependencies and libraries

Providers experienced with enterprise systems can quickly identify infrastructure-level faults.

What security and reliability standards should a debugging provider follow?

Security is a critical consideration in how to choose a debugging service provider because debugging often involves direct access to application code and logs.

Important security practices include:

  • Secure access control for debugging environments
  • Non-disclosure agreements for client code
  • Data protection policies for logs and diagnostic data
  • Isolated testing environments

Reliable providers also maintain structured change logs and documentation for every resolved defect.

Conclusion

Understanding how to choose a debugging service provider helps organizations minimize downtime, protect application integrity, and maintain reliable software operations. By evaluating expertise, tools, logging practices, and service reliability, businesses can select partners capable of resolving complex software issues efficiently. A structured selection approach ensures long-term effectiveness when working with professional debugging services.

FAQ

Which IDE is best for debugging?

Visual Studio is widely used for debugging C#, .NET applications, and Windows services because it offers integrated debugging tools and detailed runtime inspection.

What are the two types of debugging?

The two main types are manual debugging, where developers inspect code step-by-step, and automated debugging using diagnostic tools and monitoring systems.

How to debug a service program?

Debug a service program by attaching a debugger to the service process, analyzing logs, reproducing the issue, and inspecting memory or execution traces.

What are the 7 debugging steps?

The typical steps are problem identification, reproduction, log analysis, code inspection, debugging execution, fix implementation, and verification testing.

Sources

https://www.quora.com/How-do-I-identify-the-best-TSCM-and-bug-sweep-or-debugging-service-company-in-Bangalore

https://learn.microsoft.com/en-us/dotnet/framework/windows-services/how-to-debug-windows-service-applications

https://docs.bmc.com/xwiki/bin/view/Mainframe/DevX/BMC-AMI-DevX-Code-Debug-for-CICS/bcxcics1702/Customizing-after-installation/Specifying-Code-Debug-Service-Provider-Parameters/Code-Debug-Service-Provider-PROC-and-JCL

https://support.servicenow.com/kb?id=kb_article_view&sysparm_article=KB0677496

https://developer.android.com/studio/debug/dev-options

https://stackoverflow.com/questions/4008081/debugging-a-service

https://community.sap.com/t5/technology-q-a/not-able-to-debug-a-service/qaq-p/9485057

https://www.linkedin.com/pulse/aws-monitoring-debugging-services-comprehensive-guide-varun-akuthota-ajk0c

https://www.upwork.com/hire/software-debuggers/https://www.lenovo.com/in/en/glossary/what-is-debug/?srsltid=AfmBOorhLXV-vAjdreTG-dD7L2_squuV-Mq6z3Vz2JprxpNf9Vlmusuf

READ MORE
Uncategorized
Umesh Kumar KhiriMarch 3, 2026 0 Comments
Share article:TwitterFacebookLinkedin
48 Views
9 Likes

Debugging Services: 7 Proven Methods for Reliable System and Security Detection

Debugging services refer to professional methods and tools used to detect, analyze, and fix technical errors in software, systems, or communication networks. They ensure that digital environments function securely and efficiently. Whether addressing software code flaws, hardware signal interference, or electronic eavesdropping risks, effective debugging safeguards both performance and privacy.

Key Takeaways

  • Debugging services cover software, network, and surveillance detection.
  • TSCM debugging prevents data leaks and eavesdropping.
  • Kubernetes debugging relies on kubectl tools and log analysis.
  • Certified providers ensure privacy and operational integrity.
  • Regular debugging audits strengthen cybersecurity posture.

What are debugging services and how do they work?

Debugging services encompass processes designed to identify, trace, and eliminate faults within software applications, digital systems, or physical communication devices.
They operate in three main categories:

  • Software debugging: Resolving errors in application code or logic.
  • Hardware debugging: Detecting faulty circuits or hardware connections.
  • TSCM (Technical Surveillance Countermeasures): Locating hidden transmitters or unauthorized surveillance devices.

These methods combine diagnostic tools, frequency scanners, and expert analysis for precise issue resolution.

Why are debugging services essential for organizations?

Organizations rely on debugging services to:

  • Prevent data breaches caused by hidden bugs or compromised systems.
  • Maintain regulatory compliance under cybersecurity and privacy laws.
  • Ensure application reliability across distributed architectures like Kubernetes and cloud environments.
  • Detect corporate espionage through professional TSCM services in offices, vehicles, or residences.

Regular debugging audits help protect both digital and physical infrastructures from unseen vulnerabilities.

How are debugging services used in Kubernetes and cloud systems?

Debugging services in Kubernetes address issues with service configuration, DNS, and container logs.
Typical commands include:

  • kubectl get service – Displays available services.
  • kubectl logs service – Retrieves container logs.
  • kubectl debug – Starts an interactive troubleshooting container.

These tools help developers isolate faults in microservices, network policies, or DNS failures without disrupting running workloads.

What tools and methods are used in professional debugging services?

Professional debugging involves a blend of analytical tools and field equipment, such as:

CategoryExample ToolsPurpose
Software DebuggingGDB, Visual Studio DebuggerCode tracing and memory inspection
Network DebuggingWireshark, NetcatTraffic and packet-level analysis
TSCM DebuggingNon-linear junction detectors, RF scannersBug sweeping and electronic surveillance detection

This comprehensive toolkit ensures multi-layer accuracy, whether in digital systems or physical spaces.

How do debugging services differ from regular IT support?

While IT support focuses on maintenance and performance optimization, debugging services address root-cause analysis of system faults or breaches.
Key distinctions include:

  • Depth of investigation: Debugging identifies specific failure points.
  • Technical specialization: Performed by engineers or certified security experts.
  • Equipment and protocols: Employs forensic and electromagnetic analysis tools.

Users often compare debugging services with detective services, as both involve detailed investigation and evidence-based validation.

What are common scenarios requiring professional debugging?

Common use cases include:

  • Unexplained data transmission from corporate networks.
  • Application crashes or memory leaks.
  • Suspicious noises or signal interference in meeting rooms.
  • Security concerns in vehicles or smart offices.

People often inquire about related topics such as bug sweeping, TSCM detection, and wireless interference testing, reflecting widespread interest in digital and physical privacy assurance.

How to choose a reliable debugging service provider?

To ensure reliability, evaluate providers based on:

  1. Certifications: ISO 27001, CEH, or equivalent security credentials.
  2. Experience: Proven track record in corporate and personal debugging.
  3. Technology: Use of advanced RF, infrared, and network scanning tools.
  4. Confidentiality: Secure handling of sensitive information and premises.

Leading providers like Globe Detective Agency, Spy Detective Agency, and City Intelligence offer specialized bug detection and corporate TSCM solutions.

Conclusion

Debugging services remain critical to maintaining both digital and environmental security across industries. As systems grow complex, continuous detection and error isolation ensure resilient operations and privacy compliance.
For organizations seeking cost-effective expertise, exploring Affordable debugging services offers a balanced approach to protection and performance.

FAQ

What are the 7 debugging steps?

Identify, isolate, reproduce, analyze, hypothesize, fix, and verify the issue.

Can ChatGPT debug my code?

Yes, it can assist with syntax and logical analysis but cannot access or modify your live systems.

Who is the best private detective in India?

Agencies like Globe Detective Agency and AMX Detectives are well-known for professional investigative and debugging services.

What are the two types of debugging?

The two primary types are manual debugging and automated debugging.

Sources

https://amxdetectives.com/debugging-services.php
https://kubernetes.io/docs/tasks/debug/debug-application/debug-service/
https://www.indiamart.com/proddetail/debugging-services-1784950273.html?srsltid=AfmBOoopzVp8vrfPzO__MJn0gpaonoz8wMSyLxYXqw5Ns8vksT3Lt8RK
https://www.globedetective.com/tscm-services/
https://cityintelligence.net/debugging-cars-houses-offices/
https://www.instagram.com/p/DOdiRwnj_xS/
https://in.linkedin.com/company/debug-services
https://www.debugservices.com/
https://www.advancedetectiveagency.com/corporate-debugging-tscm-services-india-expert-bug-sweeping-solutions/
https://www.spydetectiveagency.com/blog/tag/debugging-services-in-delhi

READ MORE
Uncategorized
Umesh Kumar KhiriMarch 3, 2026 0 Comments
Share article:TwitterFacebookLinkedin
41 Views
11 Likes

Affordable Debugging Services: 7 Proven Options for Cost-Effective Error Resolution

Affordable debugging services refer to professional solutions designed to identify and correct software, hardware, or network errors at minimal cost. These services ensure stable performance and minimize downtime for businesses or individuals. How do these cost-effective services balance affordability with technical precision?

Key Takeaways

  • Affordable debugging services cover code, hardware, and network diagnostics.
  • They use scalable delivery models like remote or subscription-based systems.
  • Industry application spans IT, corporate, automotive, and telecom sectors.
  • Proper vetting ensures quality without security compromise.
  • Balancing cost and expertise leads to long-term reliability.

What Do Affordable Debugging Services Include?

Affordable debugging services typically cover a range of technical error-detection and correction tasks, including:

  • Software bug fixing: Identifying code-level defects in applications.
  • Hardware signal tracing: Locating hardware-level faults in embedded systems.
  • Network debugging: Detecting connectivity or latency issues.
  • Corporate bug sweeping: Identifying and removing hidden surveillance or tracking devices.

Such services are used by IT teams, web developers, and even corporate security agencies.

How Do Professionals Deliver Affordable Debugging Services?

Service providers achieve affordability through efficient resource allocation and scalable models such as:

  1. Remote debugging via secure access protocols.
  2. Freelance debugging through platforms like Fiverr and Truelancer.
  3. Subscription-based packages that reduce hourly rates.
  4. Automated tools integrated with manual code reviews.

Example: Many developers use Visual Studio’s built-in debugger or open-source frameworks like GDB to minimize costs while maintaining accuracy.

Why Are Affordable Debugging Services Important for Businesses?

Businesses depend on debugging to ensure:

  • System stability: Reducing crashes and unplanned downtime.
  • Cost control: Avoiding expensive production disruptions.
  • Compliance: Meeting technical standards in regulated sectors like finance or healthcare.

Affordable solutions allow startups and SMEs to maintain the same quality assurance levels as larger enterprises without excessive financial strain.

What Are the Common Pricing Models for Affordable Debugging Services?

Pricing depends on project type, duration, and expertise level.

Pricing ModelDescriptionTypical Range (USD)
Hourly RatePay for actual debugging time$10 – $50/hr
Fixed ProjectPredefined scope and deliverables$100 – $500/project
SubscriptionOngoing monthly maintenance$50 – $200/month
Corporate SweepSurveillance bug removal$150 – $1000/service

For in-depth analysis, see related discussions on how much do outsourced debugging services cost.

How Do Affordable Debugging Services Differ Across Industries?

  • Software & Web Development: Focus on bug tracking and version control.
  • Automotive Diagnostics: Uses hardware scanners for ECU error analysis.
  • Corporate Security: Involves debugging electronic listening or GPS devices.
  • Telecommunication: Identifies signal loss or data packet issues.

Related context: Many users exploring debugging services also research remote code debugging, corporate bug sweeping, and IoT security diagnostics as adjacent solutions.

How Can Businesses Choose the Right Affordable Debugging Partner?

Consider the following evaluation criteria:

  • Experience: Verified expertise in your technology stack.
  • Tools Used: Compatibility with your software environment.
  • Transparency: Clear scope and cost estimates.
  • Confidentiality: Secure handling of proprietary code or infrastructure.

For sensitive environments, certified agencies like Advanced Detective Agency or Spy Detective Agency provide both digital and physical debugging expertise.

What Are the Risks of Choosing Extremely Cheap Debugging Services?

While low-cost options may seem appealing, risks include:

  • Incomplete fixes due to limited diagnostic depth.
  • Security vulnerabilities if third-party access isn’t secured.
  • Hidden costs for additional corrections.

Balancing affordability with verified credentials ensures sustainable results.

Conclusion

Affordable debugging services enable businesses to maintain reliable operations without high expenses. The right balance of expertise, transparency, and tool efficiency ensures consistent performance and cost control. For a detailed pricing breakdown, review the guide on how much do outsourced debugging services cost.

FAQ

Can ChatGPT debug my code?

It can identify logical or syntax errors through explanation but cannot execute or directly test code.

What are the two types of debugging?

Manual debugging and automated debugging—manual involves human review, while automated uses software tools.

What is F5 F6 F7 F8 in debugging?

These are keyboard shortcuts for controlling code execution: F5 (run), F6 (step over), F7 (step into), F8 (resume/continue).

What is the best debugging tool?

Popular tools include Visual Studio Debugger, GDB, Eclipse Debugger, and Chrome DevTools.

Sources

https://cityintelligence.net/debugging-cars-houses-offices/
https://www.truelancer.com/software-debugging-freelancers-in-india
https://www.tradeindia.com/products/debugging-service-780886.html
https://www.advancedetectiveagency.com/corporate-debugging-tscm-services-india-expert-bug-sweeping-solutions/
https://www.spydetectiveagency.com/debugging-and-sweeping-detective.html
https://thesilentwatchers.com/debugging-sweeping-services/
https://detectiveagencychandigarh.in/debugging-and-sweeping-services/
https://www.fiverr.com/hire/debugging

READ MORE
Uncategorized
Umesh Kumar KhiriMarch 3, 2026 0 Comments
Share article:TwitterFacebookLinkedin
51 Views
6 Likes

How Much Do Outsourced Debugging Services Cost: Comprehensive 2026 Pricing Overview

How much do outsourced debugging services cost refers to the average expenditure incurred when a business contracts external professionals or agencies to resolve software errors. Costs typically depend on project scale, technology stack, service duration, and vendor region. But what defines a fair market price for debugging support today?

Key Takeaways

  • Average global rate: $20–$150/hour
  • India offers the most competitive pricing
  • Monthly retainers range $800–$10,000+
  • Cost depends on code complexity and project scale
  • Outsourcing reduces downtime and resource strain

What Determines the Cost of Outsourced Debugging Services?

Several variables influence the total cost of outsourcing debugging:

  • Service scope: Minor bug fixes vs. full system audits.
  • Complexity level: Multi-language codebases and legacy integrations require higher expertise.
  • Engagement model: Hourly, monthly, or per-project billing.
  • Technology stack: Costs rise for specialized frameworks (e.g., embedded systems or cloud-native apps).
  • Geographic location: Rates differ significantly between the U.S., Europe, and Asia.

For context, people also search for related terms such as “software testing outsourcing rates,” “remote code debugging,” and “software maintenance costs.”

How Much Do Outsourced Debugging Services Cost Per Hour?

Average hourly rates in 2026 vary by provider location:

RegionAverage Hourly Rate (USD)Example Scope
North America$75–$150On-demand debugging, security fixes
Western Europe$60–$120System audits, code optimization
Eastern Europe$30–$60Ongoing code maintenance
India / Southeast Asia$20–$40Continuous bug fixing and QA
Latin America$25–$55Remote debugging support

Specialized debugging for enterprise or embedded systems can exceed $200/hour depending on urgency and tool requirements.

How Much Do Outsourced Debugging Services Cost Per Month?

Monthly retainers offer predictable pricing for continuous support.
Typical monthly costs include:

  • Small applications: $800–$1,500/month
  • Mid-size systems: $2,000–$4,500/month
  • Enterprise-grade infrastructure: $5,000–$10,000+/month

Retainers often cover proactive error monitoring, version tracking, and post-deployment debugging.

How Much Do Outsourced Debugging Services Cost in India?

India remains a global leader for cost-effective outsourced debugging services. Average rates in 2026 are:

  • Hourly: $20–$40
  • Monthly (dedicated resource): $1,000–$2,500
  • Per-project: $1,500–$5,000 depending on code volume

Indian agencies often bundle debugging with QA automation, code audits, and software optimization, delivering strong value for cost-conscious clients.

How Do Project-Based and Dedicated Models Compare?

Model TypeTypical UseCost RangeKey Benefit
Project-basedOne-time fixes or audits$500–$10,000+Defined scope and duration
Dedicated developer/teamLong-term debugging and maintenance$2,000–$8,000/monthOngoing reliability and code continuity
Hybrid modelFlexible on-demand debuggingVariableCombines scalability with budget control

The dedicated model suits organizations with frequent releases, while project-based contracts fit short-term or urgent fixes.

Are Outsourced Debugging Services Worth the Cost?

Yes—outsourcing saves recruitment time, grants access to skilled specialists, and ensures faster turnaround. Companies with distributed systems or multilingual codebases gain particular value from 24/7 remote debugging coverage.

Conclusion

Outsourced debugging services cost anywhere from $20/hour in India to $150/hour in the U.S., depending on expertise and project demands. Selecting the right pricing model ensures both quality and cost control.
For related insight into vendor selection and connectivity setup, explore [Where can I find remote code debugging] for practical guidance.

FAQ

How much does outsourcing cost?

Average outsourced debugging costs range from $20 to $150 per hour depending on location and skill level.

How much does it cost to outsource to India?

India-based debugging services typically cost $20–$40/hour or $1,000–$2,500/month.

What affects outsourced debugging prices?

Code complexity, technology stack, project urgency, and vendor region are key determinants.

Are there hidden costs in outsourced debugging?

Potential extras include emergency support, tool licenses, and after-hours maintenance.

Do companies offer debugging bundles with QA or DevOps?

Yes, many vendors integrate debugging with testing, automation, and CI/CD pipelines for efficiency.

Sources

http://advancedetectiveagency.com/business-bug-sweep-services-cost-in-india
https://www.indiamart.com/proddetail/debugging-investigation-services-21101580562.html?srsltid=AfmBOopJwNunjikQB-UapO7JriN_aAeyoXSUF1TtQabPIu0jh2exvxgK
https://www.encomputers.com/2024/01/how-much-do-outsourced-it-services-cost/
https://www.rekalltech.com/how-much-do-outsourced-it-services-cost/
https://www.wisemonk.io/blogs/software-development-outsourcing-costs-in-india
https://atidiv.com/cost-of-outsourced-it-support/
https://www.vrinsofts.com/outsourcing-software-development-cost-guide/
https://www.tradeindia.com/products/due-diligence-and-debugging-services-2906704.html
https://supportyourapp.com/blog/cost-of-outsourced-it-support/
https://dac.digital/it-outsourcing-costs-how-much-does-it-cost-to-outsource-software-development/

READ MORE
Uncategorized
Umesh Kumar KhiriMarch 2, 2026 0 Comments
Share article:TwitterFacebookLinkedin
46 Views
6 Likes

Where Can I Find Remote Code Debugging: 7 Proven Tools and Secure Setup Practices

Where can I find remote code debugging refers to identifying tools and environments that let developers inspect, test, and troubleshoot code on remote servers or client machines. This method enables seamless collaboration across global teams and supports applications that cannot be debugged locally. Remote debugging is essential in scenarios like mobile app development, embedded systems, or server-side testing.

KEY TAKEAWAYS

  • Remote code debugging allows inspection of remote systems from local environments.
  • Visual Studio, VS Code, and Chrome DevTools offer robust support.
  • Secure connections and version matching are critical for stability.
  • Ideal for cross-platform, server-side, and Android development.
  • Encrypted network protocols ensure enterprise-level data safety.

What Is Remote Code Debugging and Why Is It Important?

Remote code debugging enables developers to execute and monitor applications running on remote machines from their local IDE.
Key benefits include:

  • Detecting production-level issues without disrupting live systems
  • Cross-platform compatibility testing
  • Improved workflow for distributed development teams
    Example: Debugging a Node.js application running on a remote Linux server via Visual Studio Code Remote Development tools.

Where Can I Find Remote Code Debugging Tools?

You can find remote code debugging tools in major integrated development environments (IDEs) and open-source platforms such as:

  • Visual Studio Remote Debugger (2022 & 2026 versions) – for .NET and C++ projects.
  • VS Code Remote Development Extension – supports SSH, WSL, and Containers.
  • JetBrains IntelliJ IDEA – for Java and Kotlin debugging using TCP/IP.
  • Chrome DevTools Remote Debugging – ideal for web and Android-based projects.
  • LLDB Remote Debugger – for C/C++ on Unix systems.

Developers often explore related concepts such as remote debugging Android, remote debugging Chrome, and remote tools for Visual Studio 2026 for specialized workflows.

How Does Remote Debugging Work in Visual Studio?

Remote debugging in Visual Studio requires a Remote Tools package installed on the target machine.
Steps:

  1. Install Remote Tools for Visual Studio (matching the IDE version).
  2. Launch the Remote Debugger and set the appropriate authentication mode.
  3. Access Debug → Attach to Process in Visual Studio, then input the remote machine’s IP for connection..
  4. Begin debugging session securely via network connection.
    This configuration allows breakpoint monitoring and variable inspection across devices.

Can I Use Remote Code Debugging for Web and Chrome Applications?

Yes. Chrome DevTools supports remote debugging over USB or network connections.
Example Workflow:

  • Enable “Remote Debugging” by launching Chrome with the flag:

chrome.exe –remote-debugging-port=9222

  • Connect via Chrome DevTools → Devices → Inspect.
    This method is widely used for debugging web apps, progressive web applications (PWAs), and hybrid Android projects.

How Is Remote Debugging Used in Android Development?

Android Studio and Chrome DevTools provide built-in remote debugging options.
Common setup:

  • Connect Android device via USB or ADB.
  • Enable “Developer Options” → “USB Debugging.”
  • Use adb connect <IP> for wireless debugging.
    Remote code debugging helps test live mobile app performance on real devices, ensuring platform consistency.

What Are the Best Practices for Secure Remote Debugging?

To protect data and maintain compliance with enterprise policies:

  • Use encrypted connections (SSH or TLS)
  • Configure firewall and access control lists (ACLs)
  • Do not perform debugging operations in operational production environments.
  •  Implement multi-factor authentication to safeguard sensitive debugging environments.

What Are Common Issues and How to Troubleshoot Them?

Frequent issues include:

ProblemLikely CauseRecommended Fix
Connection timeoutFirewall blocking portOpen the required port (e.g., 4020–4030 for Visual Studio)
Mismatched debugger versionsIDE and remote tool mismatchInstall the same Visual Studio version remotely
Access deniedIncorrect permissionsRun as Administrator or update credentials
Session dropNetwork instabilityUse persistent SSH or VPN connection

Conclusion

Where Can I Find Remote Code Debugging- Remote code debugging bridges the gap between local development and distributed environments by offering precise control and visibility across systems. Whether using Visual Studio, Chrome DevTools, or Android Studio, implementing structured debugging ensures efficient and secure code optimization.
For developers seeking advanced enterprise-ready tools, explore Top rated remote debugging services to streamline workflow efficiency.

FAQ

Where can I debug my code?

You can debug your code in IDEs like Visual Studio, VS Code, or IntelliJ IDEA using built-in or remote debugging features.

What is remote debugging?

Remote debugging lets you inspect and control an application running on another device or server through your local IDE.

Where can I see debugging?

Debugging sessions appear in the IDE’s debug console or terminal, displaying breakpoints, variable states, and stack traces.

How do I open remote debugging in Chrome?

Launch Chrome using –remote-debugging-port=9222, then open Chrome DevTools → Devices → Inspect to start the session.

Sources

https://learn.microsoft.com/en-us/visualstudio/debugger/remote-debugging?view=visualstudio
https://code.visualstudio.com/docs/remote/remote-overview
https://developer.chrome.com/docs/devtools/remote-debugging
https://stackoverflow.com/questions/73378057/how-to-debug-remote-python-script-in-vs-code
https://www.jetbrains.com/help/idea/tutorial-remote-debug.html
https://lldb.llvm.org/use/remote.html
https://www.freecodecamp.org/news/remote-debugging-tools/
https://medium.com/@spe_/debugging-c-c-programs-remotely-using-visual-studio-code-and-gdbserver-559d3434fb78

READ MORE
Uncategorized
Umesh Kumar KhiriMarch 2, 2026 0 Comments
Share article:TwitterFacebookLinkedin
50 Views
9 Likes

Top Rated Remote Debugging Services: 7 Proven Tools for Developers

Top rated remote debugging services refer to cloud-based or network-enabled tools that allow developers to inspect, trace, and resolve code issues running on remote machines. These services are critical in modern DevOps, supporting multi-environment development, mobile testing, and production troubleshooting.

Key Takeaways

  • Remote debugging enables live inspection of code on distant systems.
  • Visual Studio and Chrome DevTools dominate modern debugging ecosystems.
  • Security and compliance are critical for enterprise adoption.
  • Remote debugging improves efficiency in cloud, IoT, and hybrid workflows.
  • Future trends include AI-driven diagnostics and unified observability.

What are the top rated remote debugging services used in modern development?

Leading remote debugging services combine real-time code inspection, session recording, and collaboration tools.
Commonly used platforms include:

  • Visual Studio Remote Debugger – Ideal for .NET and C# environments.
  • Chrome DevTools – Provides JavaScript and web debugging directly in the browser.
  • Bytebeam Remote Debugging – Designed for IoT and embedded device monitoring.
  • Remote.it – Enables secure, encrypted access to remote devices without VPNs.
  • Testmu AI Debugging Suite – Integrates with automation testing for cross-browser validation.
    These services streamline debugging by removing location constraints and enabling real-time analysis across global teams.

How do remote debugging services work in distributed development?

Remote debugging connects a local IDE to a remote process through a secure protocol such as SSH, WebSocket, or HTTPS. The workflow typically involves:

  1. Attaching a debugger to the target application.
  2. Establishing a secure session between local and remote environments.
  3. Analyzing variables, logs, and call stacks live during execution.
  4. Applying patches or breakpoints without halting entire systems.
    This process reduces turnaround time in agile, containerized, and CI/CD-based projects.

Why are top rated remote debugging services important for cloud and IoT applications?

Remote debugging is essential in cloud-native and IoT ecosystems because it provides:

  • Real-time visibility into distributed code execution.
  • Minimal downtime with live patch deployment.
  • Scalability across multiple devices or containers.
    For example, Bytebeam’s IoT debugging enables remote firmware updates and data visualization for connected devices. Similarly, Microsoft Azure supports remote debugging directly through Visual Studio for seamless integration.

What are key features to evaluate in top rated remote debugging services?

When selecting a debugging solution, focus on:

FeatureDescription
Cross-Platform SupportCompatibility with Windows, Linux, macOS, Android, iOS
Secure ConnectivityEncrypted channels (SSL, SSH, or token-based authentication)
Collaboration ToolsShared sessions and annotations
Session RecordingReplayable debugging for post-mortem analysis
IDE IntegrationWorks with VS Code, JetBrains, Eclipse
Developers also explore related solutions like remote debugging C# Visual Studio 2026, Android debugging apps, and remote tools for Visual Studio 2022.

How does remote debugging enhance testing and production reliability?

Remote debugging enables developers to detect runtime issues that local testing cannot reproduce. Benefits include:

  • Early identification of environment-specific bugs.
  • Reduced manual configuration in distributed builds.
  • Faster resolution in cloud-hosted CI pipelines.
    A similar workflow is often discussed alongside observability tools, application performance monitors, and automated error reporting services used in continuous deployment.

What security standards apply to remote debugging environments?

Security compliance is a key factor. Reputable services follow:

  • TLS 1.3 encryption for data-in-transit protection.
  • Role-based access control (RBAC) for developer permissions.
  • Compliance frameworks such as ISO 27001, SOC 2, and GDPR.
    These standards ensure that remote sessions remain tamper-proof and auditable across enterprise systems.

What are future trends shaping top rated remote debugging services?

Emerging trends include:

  • AI-assisted debugging for anomaly prediction.
  • Edge debugging for real-time IoT nodes.
  • Unified cloud observability integrating debugging, tracing, and logging in one dashboard.
    As multi-cloud adoption grows, developers are increasingly investing in secure, high-performance debugging ecosystems to support global operations.

Conclusion

Top rated remote debugging services are transforming modern development through secure, intelligent, and distributed troubleshooting. Future innovations will continue integrating these tools into automated build pipelines and hybrid cloud platforms. For region-specific insights, see related coverage on debugging services in Massachusetts.

FAQ

What is F5 F6 F7 F8 in debugging?

F5 runs the program, F6 steps over functions, F7 steps into functions, and F8 continues to the next breakpoint.

Which IDE is best for debugging?

Visual Studio, JetBrains Rider, and Eclipse are top-rated IDEs for integrated debugging and remote development.

How to do remote debug?

Configure the remote host, enable port forwarding, attach the debugger, and authenticate using SSH or secure tokens.

How to enable remote debug?

Enable the remote debugger in your IDE settings, specify the target IP and port, and ensure both systems share compatible runtime environments.

Sources

https://www.bytebeam.io/remote-debugging
https://www.freecodecamp.org/news/remote-debugging-tools/
https://www.browserstack.com/guide/debugging-tools
https://www.testmuai.com/blog/best-debugging-tools/
https://learn.microsoft.com/en-us/visualstudio/debugger/remote-debugging?view=visualstudio
https://conclusive.tech/glossary/debugging-tools-the-best/
https://arc.dev/hire-developers/remote-debugging
https://community.shotgridsoftware.com/t/remote-debugging/3869
https://www.remote.it/resources/debug-production-with-remote-it
https://www.meegle.com/en_us/topics/debugging/debugging-with-remote-debugging

READ MORE
Uncategorized
Umesh Kumar KhiriMarch 2, 2026 0 Comments
Share article:TwitterFacebookLinkedin
45 Views
7 Likes

Debugging Services in Massachusetts: 7 Expert Insights to Secure Your Space and Data

Debugging services in Massachusetts refer to professional inspections that detect, analyze, and remove hidden surveillance devices or software-based vulnerabilities in communication and data systems. They are used to ensure privacy, protect intellectual property, and maintain operational integrity. What types of debugging are typically performed, and how do professionals ensure reliable results?

Key Takeaways

  • Debugging services in Massachusetts secure spaces from surveillance threats.
  • Professional sweeps employ RF, infrared, and digital analysis tools.
  • Services comply with FCC and Massachusetts state investigation regulations.
  • Costs vary by complexity and location type.
  • Reliable providers offer confidentiality and detailed reporting.

What Are Debugging Services in Massachusetts?

Debugging services in Massachusetts include systematic electronic and physical sweeps to locate hidden transmitters, spyware, or compromised hardware. These services are performed by certified investigators using specialized instruments.
Core processes include:

  • RF spectrum analysis to detect active signals
  • Infrared and thermal imaging to locate hidden devices
  • Non-linear junction detection for passive circuits
  • Data and network traffic monitoring for digital breaches

Who Needs Debugging Services in Massachusetts?

Organizations and individuals seeking protection against eavesdropping, information leaks, or digital espionage commonly request these services.
Examples include:

  • Corporate offices handling sensitive trade data
  • Law firms managing confidential case files
  • Political campaigns ensuring secure communication
  • High-net-worth individuals requiring private space audits

A related concept often discussed alongside these services includes lie detector test Rhode Island and private investigation services, as both focus on truth verification and risk mitigation.

How Do Professionals Conduct Debugging Sweeps?

Debugging professionals use a multi-phase process to ensure no surveillance or interference remains undetected:

  1. Assessment: Review of site layout and communication systems
  2. Signal Sweep: Use of spectrum analyzers and detection probes
  3. Device Inspection: Checking walls, electronics, and cabling for concealed transmitters
  4. Digital Forensics: Analysis of network logs and connected systems
  5. Final Verification: Generating a report with identified threats and corrective actions

What Equipment Is Used in Debugging Services in Massachusetts?

Industry professionals employ advanced and compliant-grade tools such as:

  • Broadband RF detectors (for wide frequency range scans)
  • Spectrum analyzers and time-domain reflectometers
  • Non-linear junction detectors (NLJD) for microchip discovery
  • Portable analyzers for vehicle and mobile device checks

These tools align with Federal Communications Commission (FCC) standards and are calibrated for precision.

Are Debugging Services in Massachusetts Regulated?

Yes. Reputable providers comply with state and federal privacy, communication, and investigation laws.
Key compliance elements:

  • Licensing under Massachusetts investigative service regulations
  • Adherence to Federal Communications Commission frequency monitoring limits
  • Data handling consistent with privacy laws such as Federal Trade Commission consumer protection guidelines

How Much Do Debugging Services Cost in Massachusetts?

Pricing depends on area size, complexity, and equipment used.
Typical range:

Service TypeAverage Cost (USD)
Residential Sweep$500–$1,500
Corporate Office Sweep$2,000–$7,000
Vehicle/Device Debugging$300–$800
Digital Forensics$1,000–$5,000

Costs may increase if multiple signal types or complex systems are involved.

How to Choose a Reliable Debugging Company in Massachusetts?

Select a provider that demonstrates:

  • State licensing and verified experience
  • Use of advanced, calibrated debugging tools
  • Clear post-service reporting and confidentiality agreements
  • Positive local reputation (examples include ATech Investigation Services and Eagle Investigations)

Conclusion

Debugging services in Massachusetts are essential for ensuring secure, interference-free communication and data integrity. They integrate advanced electronic detection, compliance frameworks, and professional discretion. For ongoing protection, individuals can explore debugging services near me to locate certified professionals offering local assistance.

FAQ

What does a debugging sweep include?

It includes detecting, analyzing, and removing hidden devices or electronic interference sources.

How long does a debugging inspection take?

Typical residential or office sweeps take 2–6 hours, depending on the environment size.

Are debugging services legal in Massachusetts?

Yes, when performed by licensed investigative or security professionals.

Can debugging detect wireless cameras?

Yes. RF and infrared scanners identify both active and passive wireless surveillance devices.

Do companies offer periodic debugging maintenance?

Many professionals provide scheduled quarterly or annual sweeps for high-risk environments.

Sources

https://www.spycatchersllc.com/massachusetts-bug-sweep-company/
https://atechpi.com/services/debugging-bug-sweep-services/
https://dlginvestigators.com/investigation-services/debugging-sweeps/
https://keatechinc.com/engineering-services/embedded-system-debugging-reverse-engineering-and-repairs/
https://www.haminvestigations.com/norton-ma-bug-sweeps
https://eagleinvestigations.com/
https://www.debugpestcontrol.com/southeastern-massachusetts/
https://bostonbugsweep.com/
https://www.cics.umass.edu/news/2025-distinguished-artifact-award
https://atechpi.com/

READ MORE
  • 1
  • …
  • 11
  • 12
  • 13

Recent Posts

  • Debugging Goals in Software Testing: 7 Powerful Benefits for Reliable Applications
  • Importance of Debugging in Software Development: 7 Powerful Benefits for Software Quality
  • What Is the Purpose of Debugging in Software Testing? 7 Powerful Benefits You Must Know
  • How to Debug Software: 7 Essential Methods for Finding and Fixing Errors
  • Debugging in Software Development Cycle: 7 Powerful Techniques for Error-Free Applications

Recent Comments

  1. Fred Hyman on Yellow Cap
  2. Fred Hyman on T-Shirt Full Hand
  3. Fred Hyman on Yellow Cap
  4. Randal Gray on Black T-Shirt
  5. John Harris on Black T-Shirt

Archives

  • June 2026
  • May 2026
  • April 2026
  • March 2026

Categories

  • AI in App Development
  • Uncategorized
Recent Posts
  • Debugging Goals in Software Testing: 7 Powerful Benefits for Reliable Applications
    Debugging Goals in Software Testing: 7 Powerful Benefits for Reliable Applications
    June 9, 2026
  • Importance of Debugging in Software Development: 7 Powerful Benefits for Software Quality
    Importance of Debugging in Software Development: 7 Powerful Benefits for Software Quality
    June 9, 2026
  • What Is the Purpose of Debugging in Software Testing? 7 Powerful Benefits You Must Know
    What Is the Purpose of Debugging in Software Testing? 7 Powerful Benefits You Must Know
    June 8, 2026
Categories
  • AI in App Development5
  • Uncategorized129
logotype

RCEENetworks LLC

1-844-284-3695

info@rceenetworks.com

3010 Lyndon B Johnson Fwy #1200, Dallas, TX 75234, United States

Menu

HomeServices

ProductsBlog

Contact

Other Links

RetinaWiseAI™Privacy PolicyContent PolicyTerms & Conditions

Social Links

TwitterFacebookInstagramLinkedin

Copyright © 2026 RCEENetworks LLC. All Rights Reserved