Where can I find remote code debugging refers to identifying tools and environments that let developers inspect, test, and troubleshoot code on remote servers or client machines. This method enables seamless collaboration across global teams and supports applications that cannot be debugged locally. Remote debugging is essential in scenarios like mobile app development, embedded systems, or server-side testing.
KEY TAKEAWAYS
- Remote code debugging allows inspection of remote systems from local environments.
- Visual Studio, VS Code, and Chrome DevTools offer robust support.
- Secure connections and version matching are critical for stability.
- Ideal for cross-platform, server-side, and Android development.
- Encrypted network protocols ensure enterprise-level data safety.
What Is Remote Code Debugging and Why Is It Important?
Remote code debugging enables developers to execute and monitor applications running on remote machines from their local IDE.
Key benefits include:
- Detecting production-level issues without disrupting live systems
- Cross-platform compatibility testing
- Improved workflow for distributed development teams
Example: Debugging a Node.js application running on a remote Linux server via Visual Studio Code Remote Development tools.
Where Can I Find Remote Code Debugging Tools?
You can find remote code debugging tools in major integrated development environments (IDEs) and open-source platforms such as:
- Visual Studio Remote Debugger (2022 & 2026 versions) – for .NET and C++ projects.
- VS Code Remote Development Extension – supports SSH, WSL, and Containers.
- JetBrains IntelliJ IDEA – for Java and Kotlin debugging using TCP/IP.
- Chrome DevTools Remote Debugging – ideal for web and Android-based projects.
- LLDB Remote Debugger – for C/C++ on Unix systems.
Developers often explore related concepts such as remote debugging Android, remote debugging Chrome, and remote tools for Visual Studio 2026 for specialized workflows.
How Does Remote Debugging Work in Visual Studio?
Remote debugging in Visual Studio requires a Remote Tools package installed on the target machine.
Steps:
- Install Remote Tools for Visual Studio (matching the IDE version).
- Launch the Remote Debugger and set the appropriate authentication mode.
- Access Debug → Attach to Process in Visual Studio, then input the remote machine’s IP for connection..
- Begin debugging session securely via network connection.
This configuration allows breakpoint monitoring and variable inspection across devices.
Can I Use Remote Code Debugging for Web and Chrome Applications?
Yes. Chrome DevTools supports remote debugging over USB or network connections.
Example Workflow:
- Enable “Remote Debugging” by launching Chrome with the flag:
chrome.exe –remote-debugging-port=9222
- Connect via Chrome DevTools → Devices → Inspect.
This method is widely used for debugging web apps, progressive web applications (PWAs), and hybrid Android projects.
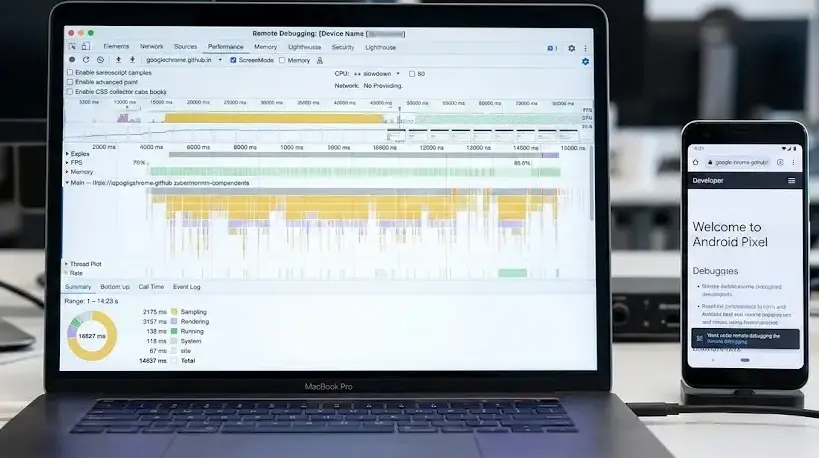
How Is Remote Debugging Used in Android Development?
Android Studio and Chrome DevTools provide built-in remote debugging options.
Common setup:
- Connect Android device via USB or ADB.
- Enable “Developer Options” → “USB Debugging.”
- Use adb connect <IP> for wireless debugging.
Remote code debugging helps test live mobile app performance on real devices, ensuring platform consistency.
What Are the Best Practices for Secure Remote Debugging?
To protect data and maintain compliance with enterprise policies:
- Use encrypted connections (SSH or TLS)
- Configure firewall and access control lists (ACLs)
- Do not perform debugging operations in operational production environments.
- Implement multi-factor authentication to safeguard sensitive debugging environments.
What Are Common Issues and How to Troubleshoot Them?
Frequent issues include:
| Problem | Likely Cause | Recommended Fix |
| Connection timeout | Firewall blocking port | Open the required port (e.g., 4020–4030 for Visual Studio) |
| Mismatched debugger versions | IDE and remote tool mismatch | Install the same Visual Studio version remotely |
| Access denied | Incorrect permissions | Run as Administrator or update credentials |
| Session drop | Network instability | Use persistent SSH or VPN connection |
Conclusion
Where Can I Find Remote Code Debugging- Remote code debugging bridges the gap between local development and distributed environments by offering precise control and visibility across systems. Whether using Visual Studio, Chrome DevTools, or Android Studio, implementing structured debugging ensures efficient and secure code optimization.
For developers seeking advanced enterprise-ready tools, explore Top rated remote debugging services to streamline workflow efficiency.
FAQ
Where can I debug my code?
You can debug your code in IDEs like Visual Studio, VS Code, or IntelliJ IDEA using built-in or remote debugging features.
What is remote debugging?
Remote debugging lets you inspect and control an application running on another device or server through your local IDE.
Where can I see debugging?
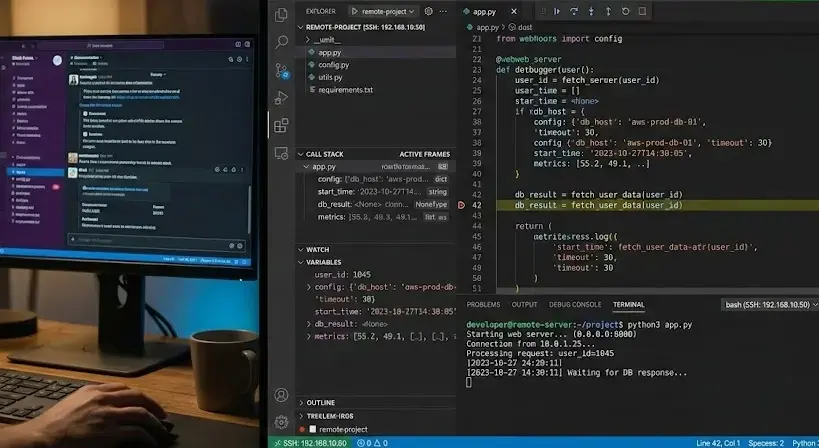
Debugging sessions appear in the IDE’s debug console or terminal, displaying breakpoints, variable states, and stack traces.
How do I open remote debugging in Chrome?
Launch Chrome using –remote-debugging-port=9222, then open Chrome DevTools → Devices → Inspect to start the session.
Sources
https://learn.microsoft.com/en-us/visualstudio/debugger/remote-debugging?view=visualstudio
https://code.visualstudio.com/docs/remote/remote-overview
https://developer.chrome.com/docs/devtools/remote-debugging
https://stackoverflow.com/questions/73378057/how-to-debug-remote-python-script-in-vs-code
https://www.jetbrains.com/help/idea/tutorial-remote-debug.html
https://lldb.llvm.org/use/remote.html
https://www.freecodecamp.org/news/remote-debugging-tools/
https://medium.com/@spe_/debugging-c-c-programs-remotely-using-visual-studio-code-and-gdbserver-559d3434fb78