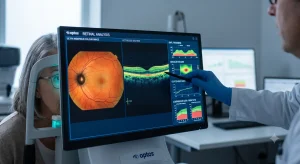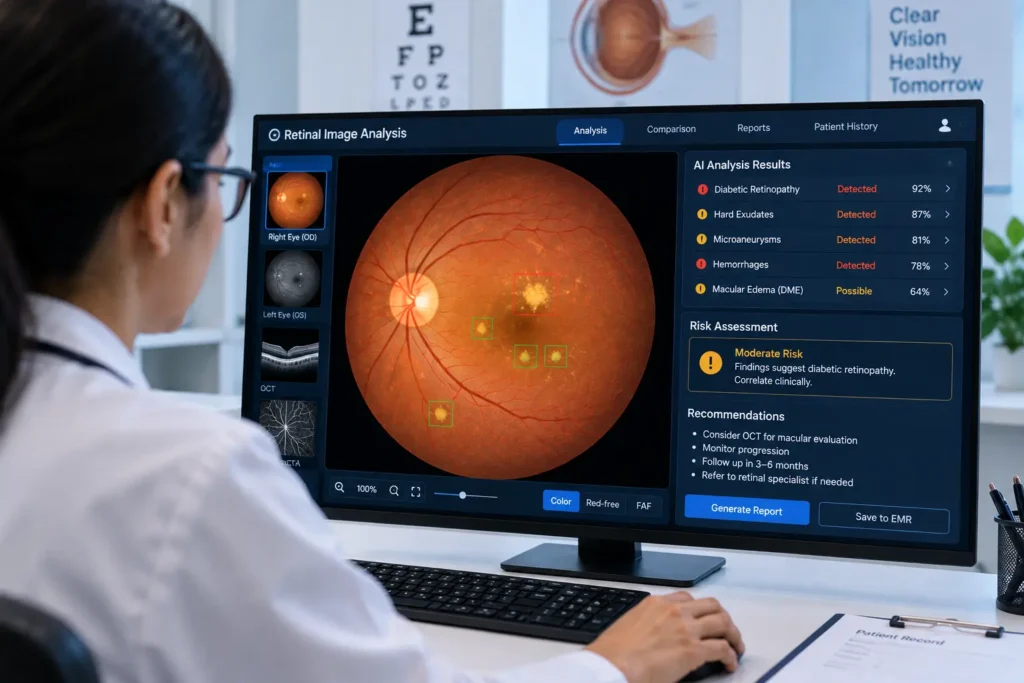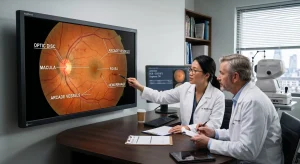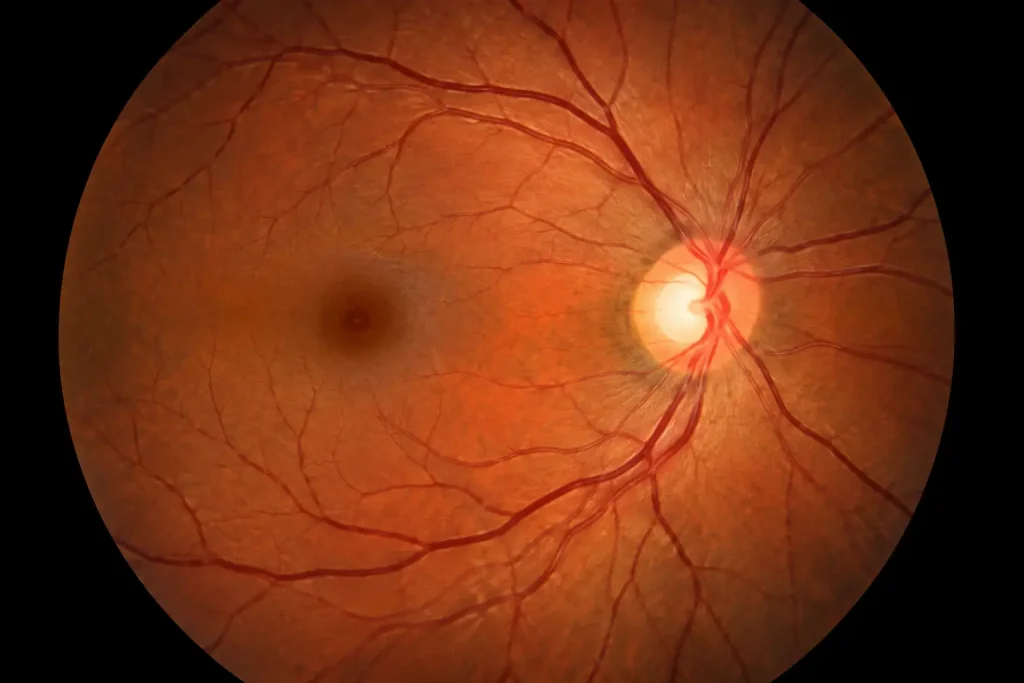
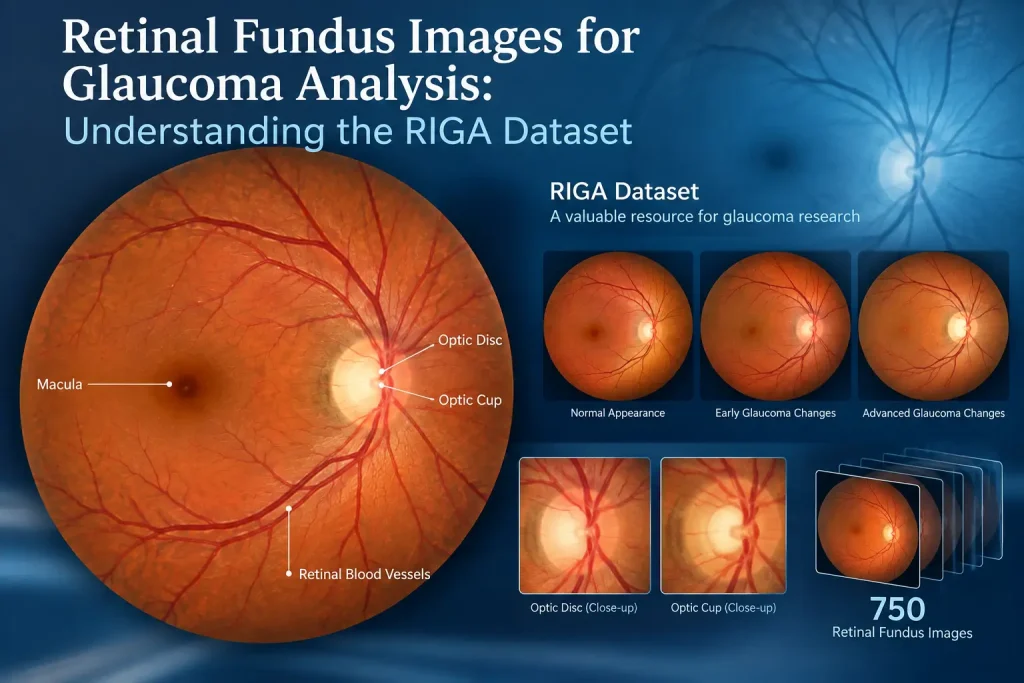
One dataset that has attracted attention in this area is the RIGA dataset, which stands for retinal fundus images for glaucoma analysis the riga dataset . It was developed to support research involving retinal image analysis, particularly the segmentation of the optic disc and optic cup.
Key Takeaways
- RIGA contains 750 retinal fundus images for glaucoma-related research.
- Optic disc and optic cup annotations support detailed image analysis.
- Researchers can use RIGA for segmentation and cup-to-disc ratio (CDR) studies.
- RIGA is not a definitive glaucoma classification dataset, so its limitations matter.
Glaucoma is an eye disease that can gradually damage the optic nerve and may lead to permanent vision loss if it is not detected and managed in time. Retinal fundus imaging gives eye care professionals a clear view of the optic disc, optic cup, retinal blood vessels, and surrounding structures. These images are also widely used in research to develop computer-based methods for glaucoma assessment.
What Is the retinal fundus images for glaucoma analysis the riga dataset?
The RIGA dataset contains 750 color retinal fundus images collected from three different sources. The images were obtained from MESSIDOR, Bin Rushed Ophthalmic Center, and Magrabi Eye Center.
A key feature of RIGA is its expert annotations. Six ophthalmologists contributed manual delineations of the optic disc and optic cup. These annotations allow researchers to compare automated segmentation results with expert-defined boundaries.
RIGA Dataset at a Glance
| Feature | Details |
| Full name | Retinal Fundus Images for Glaucoma Analysis |
| Number of images | 750 |
| Image type | Color retinal fundus photographs |
| Main structures | Optic disc and optic cup |
| Expert annotation | Six ophthalmologists |
| Main research use | Disc and cup segmentation |
| Data sources | MESSIDOR, Bin Rushed, Magrabi |
| Common analysis | Cup-to-disc ratio and optic nerve head assessment |
Why Is RIGA Useful for Glaucoma Analysis?
Glaucoma can cause structural changes around the optic nerve head. One measurement frequently studied in retinal image analysis is the cup-to-disc ratio (CDR).
The optic disc is the area where the optic nerve leaves the eye, while the optic cup is the central depression within the disc. Researchers can calculate the CDR after identifying these structures in a fundus image.
For example:
Vertical CDR = Vertical cup diameter ÷ Vertical disc diameter
RIGA’s optic disc and optic cup annotations make it useful for developing and testing algorithms that can identify these structures automatically.
However, CDR is only one part of glaucoma assessment. It should not be considered a standalone method for diagnosing glaucoma.
What Can Researchers Do With the retinal fundus images for glaucoma analysis the riga dataset ?
The dataset can support several research activities, including:
- Optic disc segmentation: Identifying the boundary of the optic disc.
- Optic cup segmentation: Detecting the central cup within the optic disc.
- Cup-to-disc ratio calculation: Measuring structural relationships between the cup and disc.
- Image-processing research: Testing methods for improving retinal image analysis.
- Segmentation model evaluation: Comparing automated results against expert annotations.
- Glaucoma-related research: Investigating retinal features associated with glaucoma assessment.
The dataset is particularly useful when the research goal is focused on structural analysis of the optic nerve head rather than simply classifying an image as glaucoma or non-glaucoma.
Also Read:Retinal Fundus Image Analysis
RIGA Dataset Limitations
Researchers should understand an important limitation before using retinal fundus images for glaucoma analysis the riga dataset . Although the dataset was created for glaucoma analysis and includes images associated with different clinical conditions, it does not provide definitive glaucoma diagnosis labels for every image.
This means RIGA is not necessarily suitable as a conventional supervised dataset for training a model to predict whether a patient has glaucoma.
There are also differences in image resolution and acquisition conditions because the photographs came from multiple sources. These variations can affect segmentation performance and should be considered when designing experiments.
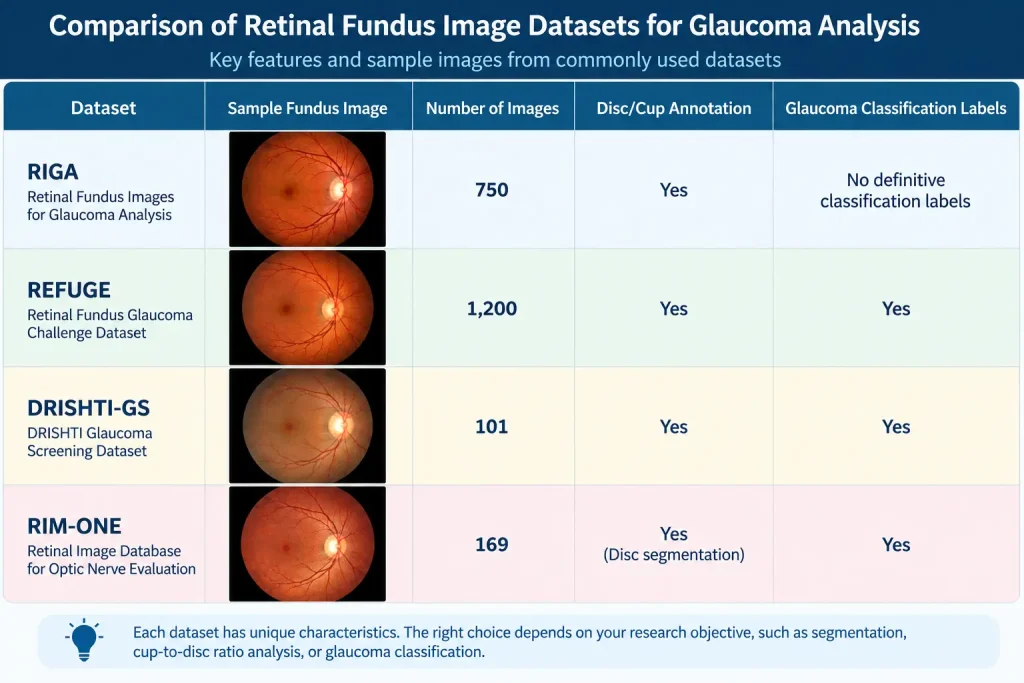
RIGA Compared With Other Datasets
| Dataset | Fundus Images | Disc/Cup Annotation | Glaucoma Classification |
| RIGA | 750 | Yes | Limited/Not definitive |
| REFUGE | 1,200 | Yes | Yes |
| DRISHTI-GS | 101 | Yes | Yes |
| RIM-ONE | 169 | Disc-related annotations | Yes |
The appropriate dataset depends on the research objective. RIGA is especially relevant when researchers need annotated optic disc and optic cup images for segmentation studies.
How RIGA Fits Into Retinal Image Analysis
A typical research workflow may look like this:
Fundus Image → Optic Disc Detection → Optic Cup Segmentation → CDR Measurement → Clinical Decision-Support
An AI-powered clinical decision-support system can use these measurements as one source of information, while clinical examination and other diagnostic tests remain important.
Conclusion
The retinal fundus images for glaucoma analysis the riga dataset is a useful resource for researchers working with retinal fundus images for glaucoma analysis. Its 750 images and expert optic disc and optic cup annotations make it particularly valuable for segmentation, CDR measurement, and optic nerve head research.
For glaucoma classification, however, researchers may need a dataset with clearly defined diagnostic labels. Understanding this distinction helps ensure that RIGA is used appropriately and that research results are interpreted in the right clinical context.
FAQ
Is RIGA a glaucoma dataset?
RIGA is designed for glaucoma-related retinal image research, but it is primarily known for its optic disc and optic cup annotations rather than definitive glaucoma diagnosis labels.
How many images are in RIGA?
The dataset contains 750 color retinal fundus images.
What are the main annotations in RIGA?
The main annotations identify the boundaries and characteristics of the optic disc and optic cup.
Can RIGA be used to calculate CDR?
Yes. The disc and cup annotations can be used to study and calculate vertical or horizontal cup-to-disc ratios.
Is RIGA suitable for glaucoma classification?
It can support glaucoma-related research, but researchers should be careful about using it as a direct glaucoma classification dataset because definitive diagnostic labels are not provided for every image.