Automotive debugging software refers to specialized diagnostic and analysis tools used to detect software, firmware, and hardware issues in vehicle electronic systems. These tools support automotive engineers during ECU development, embedded testing, and communication protocol validation. As vehicles increasingly depend on connected and software-defined architectures, debugging platforms are essential for reliability, cybersecurity, and functional safety compliance.
Key Takeaways
- Automotive debugging software supports ECU and embedded system diagnostics.
- JTAG and hardware debuggers enable low-level firmware analysis.
- TRACE32 and Lauterbach tools are widely used in automotive engineering.
- CAN bus and embedded communication debugging are essential for vehicle reliability.
- Structured debugging processes improve software validation and functional safety compliance.
What Is Automotive Debugging Software Used For?
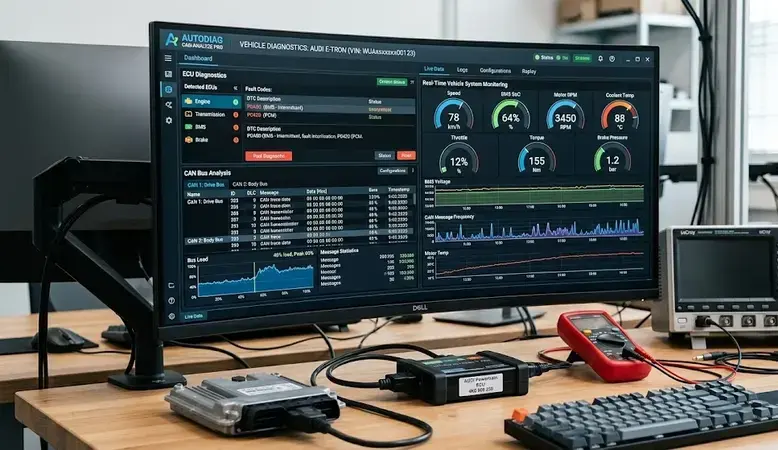
Automotive debugging software is primarily used to monitor, test, and troubleshoot embedded vehicle systems. It enables engineers to inspect ECU behavior, analyze communication protocols, and validate software execution in real time.
Common applications include:
- ECU firmware debugging
- CAN, LIN, and FlexRay network analysis
- Real-time trace monitoring
- Embedded software validation
- Functional safety verification
| Automotive Component | Debugging Purpose |
| ECU | Fault isolation and firmware analysis |
| CAN Bus | Communication packet inspection |
| Sensors | Signal verification |
| ADAS Modules | Real-time system testing |
| Infotainment Systems | Software performance diagnostics |
Many engineers also compare related technologies such as debugging tools in embedded system environments, JTAG debugger interfaces, and hardware debugger platforms for low-level diagnostics.
Which Automotive Debugging Tools Are Commonly Used?
Automotive debugging software often includes hardware-assisted and software-based diagnostic tools.
SEGGER J Link Debug Pro
SEGGER J-Link Debug Pro supports ARM-based automotive microcontrollers and enables fast flash programming, breakpoint debugging, and real-time trace analysis.
Key features:
- High-speed JTAG/SWD debugging
- Embedded trace capture
- RTOS-aware debugging
- Automotive ECU compatibility
Lauterbach Debugger
The Lauterbach debugger is widely used for advanced automotive ECU development and AUTOSAR validation.
Typical capabilities include:
- Multi-core debugging
- Real-time trace analysis
- ASIL-compliant development support
- Complex SoC diagnostics
OpenOCD
OpenOCD is an open-source debugging framework used for embedded firmware testing and low-level hardware communication.
It supports:
- JTAG and SWD interfaces
- Flash programming
- Remote debugging
- Cross-platform development
How Does a JTAG Debugger Support Automotive Systems?
Automotive debugging software frequently relies on JTAG debugger interfaces for low-level hardware diagnostics. JTAG enables direct communication with microcontrollers and processors inside ECUs.
A JTAG debugging workflow generally includes:
- Connecting the debugger to the ECU
- Loading firmware symbols
- Setting breakpoints
- Monitoring memory registers
- Capturing execution traces
JTAG debugging is commonly used in:
- Powertrain controllers
- Battery management systems
- ADAS modules
- Vehicle gateway ECUs
What Is TRACE32 Debugger in Automotive Engineering?
What is TRACE32 debugger functionality in automotive development? TRACE32 is a professional debugging and trace platform developed by Lauterbach for embedded and multicore automotive systems.
TRACE32 supports:
- Real-time program execution analysis
- Multi-processor synchronization
- AUTOSAR environment debugging
- Hypervisor and RTOS inspection
It is frequently deployed in:
- Autonomous driving systems
- Electric vehicle control units
- Advanced driver assistance systems
- Safety-critical embedded platforms
Which Software Debugging Techniques Improve Vehicle Diagnostics?
Automotive debugging software relies on structured software debugging techniques to improve fault detection accuracy and system reliability.
Software Used to Debug C++ Code
Many automotive ECUs are programmed in C and C++. Debugging environments help engineers inspect variables, stack traces, and memory allocation errors.
Common techniques include:
- Breakpoint analysis
- Static code inspection
- Runtime tracing
- Memory leak detection
USB Debugging Software for Windows
USB debugging software for Windows is used for firmware flashing, serial communication monitoring, and hardware-level testing in embedded automotive devices.
Examples include:
- Serial terminal tools
- USB protocol analyzers
- Device communication monitors
What Is the Process of Debugging in Software Development?
The process of debugging in software engineering follows a systematic sequence for fault identification and correction.
Testing and Debugging in Software Engineering
Testing and debugging in software engineering are closely linked during automotive software validation.
Typical debugging stages include:
- Error identification
- Fault reproduction
- Root cause analysis
- Code correction
- Regression testing
- System verification
Automotive manufacturers often combine debugging with:
- Continuous integration testing
- Simulation environments
- Hardware-in-the-loop (HIL) testing
- Functional safety validation
Conclusion
Automotive debugging software plays a critical role in ensuring reliable ECU operation, embedded system stability, and compliance with automotive safety standards. As vehicle architectures become more software-driven, structured debugging frameworks and hardware-assisted diagnostics will remain essential for efficient fault isolation and validation.
Modern engineering workflows increasingly integrate concepts from automated debugging in software engineering to improve traceability, reduce diagnostic time, and support scalable embedded development.
FAQs
What is automotive debugging software?
Automotive debugging software is a diagnostic platform used to identify and resolve faults in vehicle embedded systems, ECUs, and communication networks.
What is a hardware debugger?
A hardware debugger is a physical tool that connects to embedded processors and enables breakpoint analysis, memory inspection, and firmware tracing.
Why is JTAG debugging important in automotive systems?
JTAG debugging provides direct processor-level access for firmware testing, fault isolation, and real-time execution monitoring.
What does TRACE32 debugger do?
TRACE32 debugger analyzes embedded software execution, multicore processing behavior, and real-time trace data in automotive systems.
Which programming languages are commonly debugged in automotive ECUs?
C and C++ are the most commonly debugged programming languages in automotive embedded systems because of their low-level hardware control capabilities.
Sources
- https://promwad.com/news/top-debugging-tools-embedded-systems-2025
- https://www.linkedin.com/advice/0/how-can-you-use-software-debugger-electronic-wi3oc
- https://ceur-ws.org/Vol-1531/paper5.pdf
- https://www.lauterbach.com/industries/automotive
- https://www.createq.com/en/software-engineering-hub/ai-debugging-tools
- https://appinventiv.com/automotive-software-development-services/
- https://www.swri.org/markets/electronics-automation/software/automotive-software
- https://www.teledynelecroy.com/options/productseries.aspx?mseries=598&groupid=140
- https://www.renesas.com/en/products/automotive-products/automotive-software-tools?srsltid=AfmBOorA-eblSMv12YdQZHOluaT2Co-6leQDvZdn7Xnz8ugeHEKqvtzg