A debugging software example is a practical illustration of the process used to locate, investigate, and correct software defects. Debugging helps developers understand why a program produces unexpected results and how those issues can be resolved efficiently. Whether working on web applications, embedded devices, or enterprise systems, structured debugging practices improve software reliability, maintainability, and performance.
Key Takeaways
- Debugging identifies and resolves software defects systematically.
- A structured workflow improves troubleshooting efficiency.
- Debugging tools help analyze execution, memory, and performance issues.
- Embedded and system software require specialized debugging techniques.
- JTAG is widely used for microprocessor and embedded debugging.
- Verification is essential to confirm successful defect resolution.
- Documentation helps prevent recurring software issues.
What Is Debugging in Software Development?
A debugging software example typically begins when a defect is discovered during development, testing, or production use. Debugging is the systematic process of identifying the root cause of a software problem and implementing a corrective solution.
Example
A banking application calculates incorrect interest rates.
Debugging process:
- Reproduce the issue.
- Analyze the calculation logic.
- Identify an incorrect formula.
- Correct the code.
- Verify expected results through testing.
| Stage | Purpose |
| Detection | Identify abnormal behavior |
| Diagnosis | Find root cause |
| Correction | Apply fix |
| Verification | Confirm issue resolution |
Steps in the Software Debugging Process
A debugging software example follows a structured workflow to ensure defects are resolved effectively.
Common Steps
- Identify the defect
- Review user reports or test failures.
- Reproduce the issue
- Create consistent conditions.
- Collect diagnostic information
- Examine logs, traces, and error messages.
- Analyze root causes
- Review code paths and data flow.
- Implement corrections
- Modify defective code.
- Retest the application
- Verify functionality and stability.
- Document findings
- Record lessons learned and preventive actions.
These practices align with software engineering quality-management principles commonly used throughout the industry.
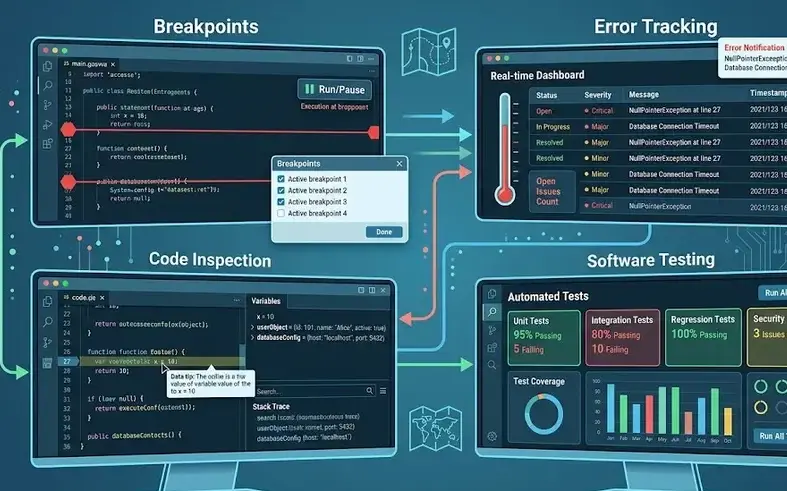
Common Debugging Tools and Techniques with Examples
A debugging software example often relies on specialized tools that help isolate defects quickly.
| Tool Type | Example Use |
| Integrated Debuggers | Step-by-step code execution |
| Log Analysis Tools | Reviewing application events |
| Memory Profilers | Detecting memory leaks |
| Static Analysis Tools | Finding code vulnerabilities |
| Performance Monitors | Identifying bottlenecks |
Example Techniques
- Breakpoint debugging
- Stack trace analysis
- Variable inspection
- Code instrumentation
- Memory dump analysis
Many professionals also explore topics such as debugging in software testing, debugging tools in software engineering, and debugging diagrams to better understand troubleshooting workflows.
How to Improve Embedded Software Debugging
Embedded systems present unique challenges because software interacts directly with hardware components.
Best practices include:
- Using real-time trace tools
- Monitoring hardware registers
- Implementing diagnostic logging
- Creating repeatable test environments
- Performing hardware-in-the-loop testing
These methods improve fault isolation and reduce troubleshooting time in embedded environments.
JTAG and Microprocessor Software Debugging Tools
JTAG is a widely used interface for debugging microprocessors and embedded systems.
Key capabilities include:
- Processor state inspection
- Breakpoint management
- Memory examination
- Register monitoring
- Real-time code execution control
Commonly used in microcontroller and processor development, JTAG supports efficient low-level software debugging.
Debugging Methods in System Software
System software requires advanced debugging approaches due to its interaction with operating systems and hardware resources.
Common methods include:
- Kernel debugging
- Event tracing
- Crash dump analysis
- Driver verification
- Performance profiling
These techniques help maintain system stability and reliability.
What Is Debugging in Programming?
A debugging software example in programming involves locating errors within source code and correcting them before deployment. Programmers use debuggers to inspect variables, monitor execution flow, and verify expected outputs.
What Is Debugging in C?
In C programming, debugging focuses on issues such as:
- Memory leaks
- Buffer overflows
- Null pointer dereferences
- Segmentation faults
- Logic errors
Tools such as GDB and integrated development environment debuggers assist in diagnosing these problems.
Conclusion
Understanding a debugging software example helps organizations apply a structured framework for defect detection, diagnosis, correction, and verification. As software systems become increasingly complex, disciplined debugging practices remain essential for reliability, security, and long-term maintainability. For broader development strategies, organizations may also explore how to improve embedded software debugging to strengthen troubleshooting capabilities in hardware-dependent environments.
FAQ
What is debugging in programming?
Debugging in programming is the process of identifying, analyzing, and fixing software defects that cause incorrect behavior or failures.
Why is debugging important in software testing?
Debugging determines the root cause of defects discovered during testing and enables developers to implement effective corrections.
What are the most common debugging tools?
Common debugging tools include integrated debuggers, log analyzers, memory profilers, static code analyzers, and performance monitoring tools.
What is JTAG debugging?
JTAG debugging uses a hardware interface that allows developers to inspect processor states, memory, and registers during software execution.
What are the main steps of debugging?
The main steps are defect identification, reproduction, diagnosis, correction, verification, and documentation.
Sources
- https://www.tricentis.com/learn/debugging
- https://www.guvi.in/blog/debugging-in-software-development/
- https://www.testmuai.com/blog/best-debugging-tools/
- https://www.ibm.com/docs/en/aix/7.2.0?topic=concepts-debugging-programs
- https://www.geeksforgeeks.org/software-engineering/software-engineering-debugging/
- https://www.meegle.com/en_us/topics/debugging/debugging-in-software-engineering
- https://saucelabs.com/resources/blog/best-debugging-tools
- https://www.ranorex.com/blog/what-is-debugging-software-testing/
- https://www.sciencedirect.com/topics/computer-science/debug-software