Software Engineering Debugging: 7 Powerful Tools and Best Practices Explained
Software engineering debugging is the process of locating, diagnosing, and fixing errors, defects, or unexpected behavior in software systems. It helps developers ensure that applications perform according to design requirements and user expectations. Effective debugging reduces system failures, improves maintainability, and supports quality assurance efforts across modern software projects.
Key Takeaways
- Software engineering debugging identifies and fixes software defects.
- A structured debugging cycle improves problem resolution efficiency.
- Debugging enhances reliability, security, and software quality.
- Embedded systems require specialized debugging approaches.
- Interactive debugging provides real-time insight into program execution.
- Debugging tools help isolate faults and validate corrective actions.
- Different debugging methods are suitable for different defect types.
What Is Debugging in Software Development?
Software engineering debugging involves investigating software defects, determining their root causes, and implementing corrective actions.
Common software defects include:
- Syntax errors
- Logic errors
- Runtime errors
- Integration failures
- Performance bottlenecks
Example of Debugging
A banking application calculates incorrect account balances after transactions. Developers trace the issue to an arithmetic logic error, modify the calculation routine, test the fix, and verify that balances update correctly.
Many developers also explore related topics such as what is debugging in programming, what is debugging in C, and what is debugging in Python when learning debugging fundamentals.
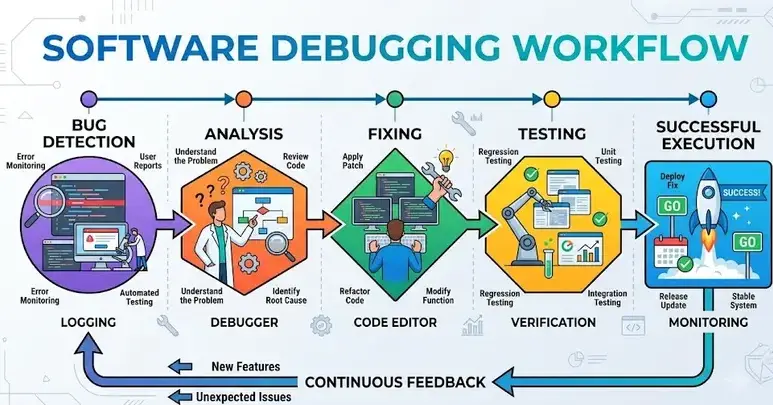
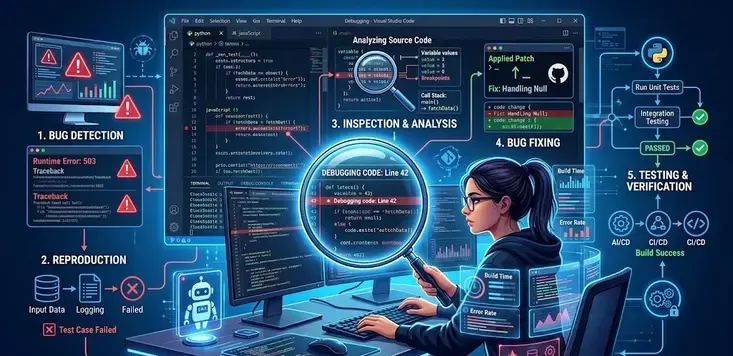
Debugging Cycle in Software Engineering: Key Steps and Process
Software engineering debugging follows a structured process that helps teams resolve issues efficiently.
| Step | Activity |
| 1 | Identify the defect |
| 2 | Reproduce the issue |
| 3 | Collect diagnostic data |
| 4 | Analyze root causes |
| 5 | Implement the fix |
| 6 | Verify the correction |
| 7 | Perform regression testing |
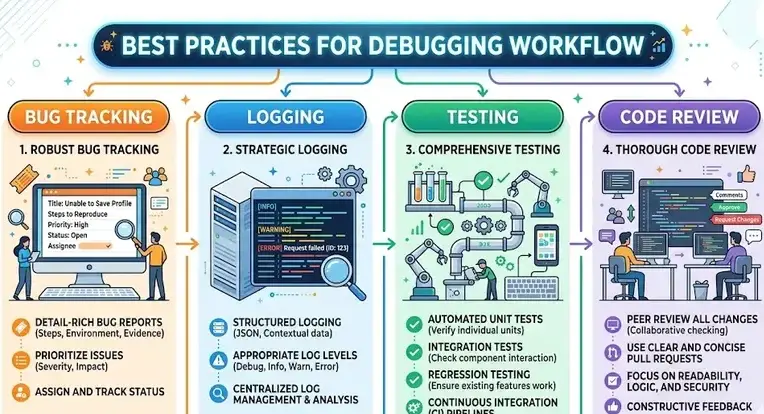
Typical Debugging Workflow
- Detect abnormal software behavior.
- Recreate the problem consistently.
- Review logs, traces, and system outputs.
- Isolate the faulty component or code section.
- Apply corrective changes.
- Test affected functionality.
- Document findings and resolutions.
Why Is Debugging Important in Software Engineering?
Software engineering debugging is essential because it improves software reliability and reduces operational risks.
Key Benefits
- Enhances software quality
- Improves user experience
- Reduces system downtime
- Strengthens application security
- Supports compliance and quality standards
- Lowers maintenance costs
Organizations commonly integrate debugging activities within quality management practices aligned with standards such as ISO 9001, software testing frameworks, and secure development methodologies.
Common Debugging Types
| Debugging Type | Purpose |
| Manual Debugging | Human investigation of code behavior |
| Remote Debugging | Analysis on external systems |
| Post-Mortem Debugging | Examination after crashes |
| Interactive Debugging | Real-time execution control |
| Automated Debugging | Tool-assisted fault detection |
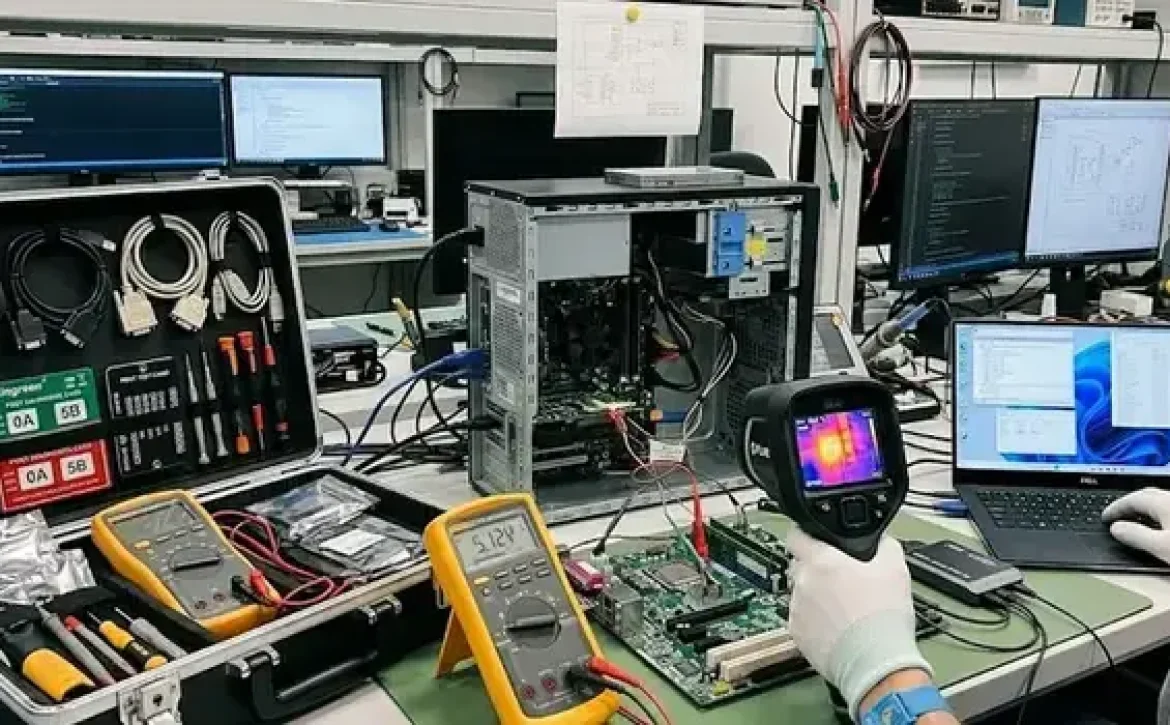
Debugging Embedded Software: Common Challenges and Solutions
Debugging embedded software presents unique difficulties because software interacts directly with hardware components.
Common Challenges
- Limited hardware resources
- Real-time processing requirements
- Hardware-software interactions
- Device-specific environments
- Timing and synchronization issues
Practical Solutions
- Use hardware emulators and simulators
- Implement detailed logging
- Apply real-time tracing tools
- Conduct hardware-in-the-loop testing
- Perform systematic fault isolation
Embedded debugging is widely used in automotive systems, industrial automation, medical devices, and Internet of Things (IoT) applications.
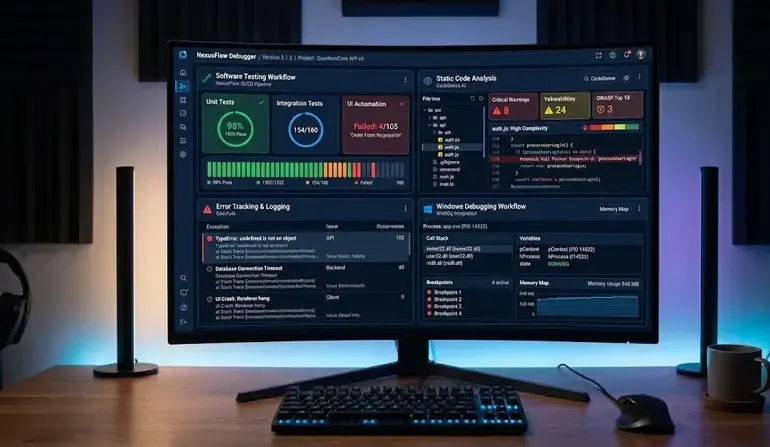
Essential Debugging Tools for Embedded and System Software
Several software engineering debugging tools help developers identify and resolve defects efficiently.
| Tool Category | Primary Purpose |
| Integrated Debuggers | Code inspection and execution control |
| JTAG Debuggers | Hardware-level debugging |
| Trace Analyzers | Runtime monitoring |
| Log Management Tools | Event analysis |
| Profilers | Performance investigation |
Examples include:
- GDB (GNU Debugger)
- LLDB
- Visual Studio Debugger
- JTAG-based debugging systems
- Performance profiling utilities
These tools support both application-level and low-level system software debugging.
Debugging Methods and Interactive Debugging Systems
Different debugging methods are selected based on system complexity and defect characteristics.
Common Methods
- Brute-force debugging
- Backtracking
- Cause elimination
- Program slicing
- Static analysis
- Dynamic analysis
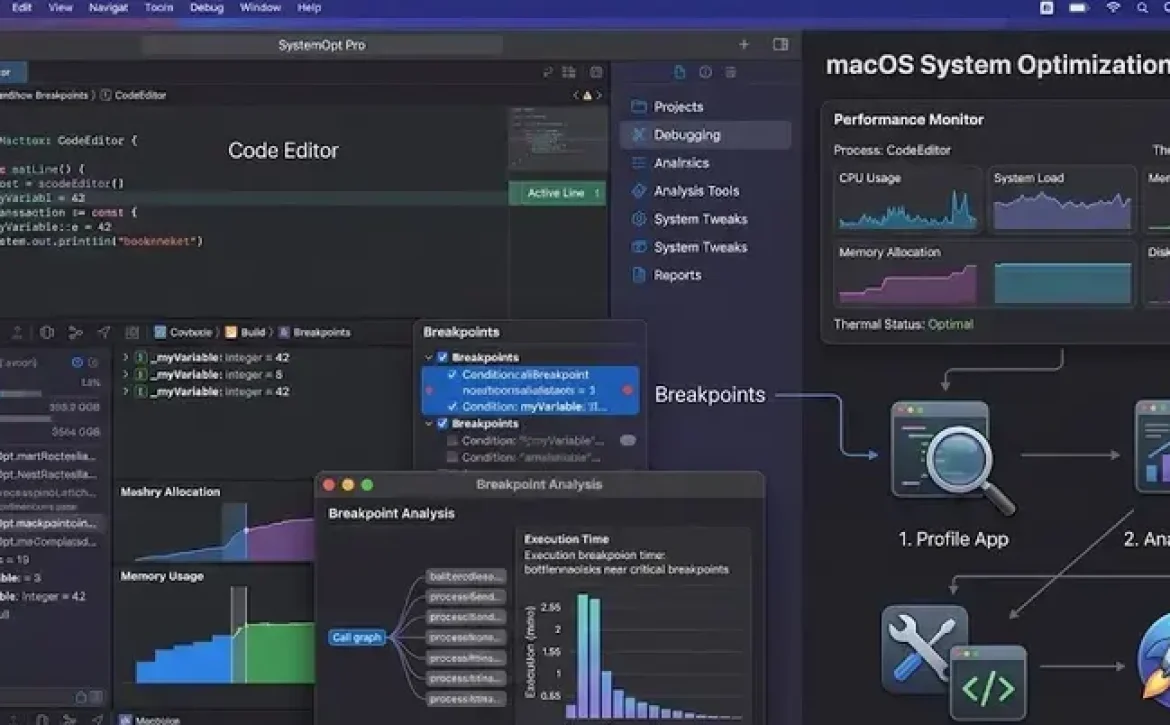
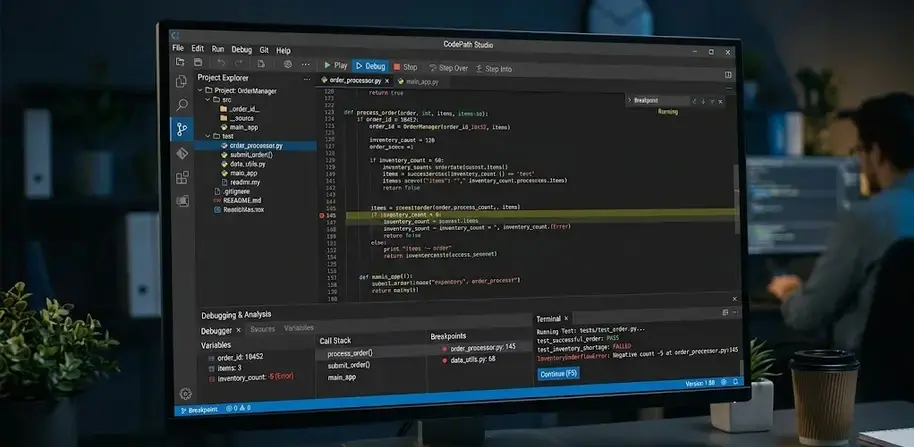
Interactive Debugging Systems
Interactive debugging systems allow developers to observe and control program execution in real time.
Key capabilities include:
- Breakpoints
- Watch variables
- Stack inspection
- Memory analysis
- Step-by-step execution
These features help developers understand program behavior and isolate faults more efficiently.

Conclusion
Software engineering debugging combines structured processes, specialized tools, and proven diagnostic techniques to identify and resolve software defects effectively. Understanding defect classifications, debugging methods, and embedded-system challenges helps development teams build more reliable applications. For broader software quality practices, it is also useful to understand debugging in software engineering as part of the overall software development lifecycle.
FAQ
What is software engineering debugging?
Software engineering debugging is the process of finding, analyzing, and correcting defects that cause software to function incorrectly.
What are the main types of debugging?
Common types include manual debugging, interactive debugging, remote debugging, post-mortem debugging, and automated debugging.
What is debugging in programming?
Debugging in programming refers to identifying and fixing coding errors that prevent programs from producing expected results.
What is debugging in C?
Debugging in C involves locating syntax, runtime, memory, and logic errors within C language programs using debugging tools and testing techniques.
What is debugging in Python?
Debugging in Python is the process of detecting and correcting errors in Python applications through debugging tools, logging, and code analysis.
Sources
- https://www.geeksforgeeks.org/software-engineering/software-engineering-debugging/
- https://www.ranorex.com/blog/what-is-debugging-software-testing/
- https://www.ibm.com/think/topics/debugging
- https://www.meegle.com/en_us/topics/debugging/debugging-in-software-engineering
- https://www.edureka.co/blog/what-is-debugging/
- https://www.tricentis.com/learn/debugging
- https://www.frugaltesting.com/blog/what-is-debugging-in-software-engineering
- https://canvas.rku.ac.in/courses/3657/pages/debugging
- https://www.scribd.com/presentation/910852023/SE-Presentation