RCEE+Networks LLC
  • Home
  • About
  • Services
    • IMACAM™ Tech Support
  • Products
    • RetinaWiseAI™
  • Contact
1-844-2-THEOWL
info@rceenetworks.com
logotype
  • Home
  • About
  • Services
    • IMACAM™ Tech Support
  • Products
    • RetinaWiseAI™
  • Contact
logotype
  • Home
  • About
  • Services
    • IMACAM™ Tech Support
  • Products
    • RetinaWiseAI™
  • Contact
Author: Umesh Kumar Khiri
Home Umesh Kumar Khiri Page 3
Uncategorized
Umesh Kumar KhiriMay 22, 2026 0 Comments
Share article:TwitterFacebookLinkedin
11 Views
0 Likes

batch file debug software: 7 Powerful Tools and Troubleshooting Methods

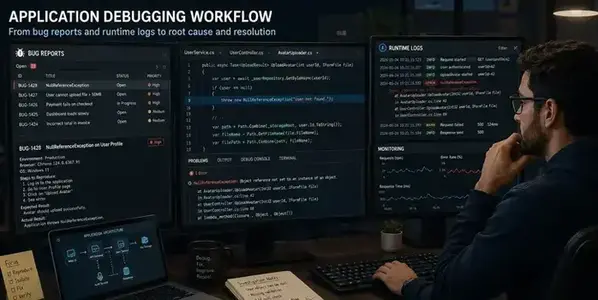
Batch file debug software refers to utilities and development environments designed to analyze, test, and troubleshoot Windows .bat and .cmd scripts. These tools help developers detect syntax errors, monitor command execution, and validate automation behavior in enterprise, IT administration, and software maintenance environments. Batch debugging remains important because legacy Windows automation scripts are still widely used in system deployment, backup scheduling, and administrative operations.

Key Takeaways

  • Batch file debug software helps troubleshoot Windows .bat and .cmd scripts.
  • Common debugging methods include echo tracing, log inspection, and ErrorLevel testing.
  • CMDebug provides dedicated breakpoint and step execution capabilities.
  • Windows 11 administrators still rely on batch automation for system maintenance.
  • Mixed-language debugging environments now support batch, PowerShell, JavaScript, and compiled applications.

Software Debugging Tools and Techniques for Batch File Troubleshooting

Testing and Debugging in Software Engineering for Batch Files

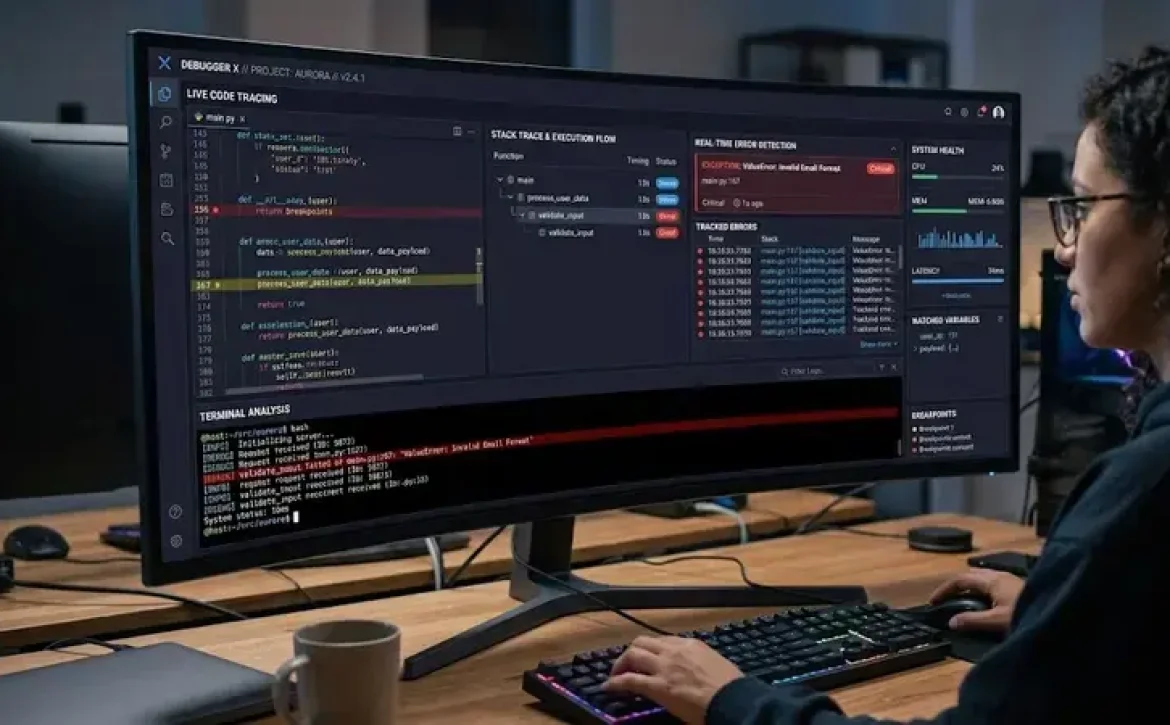
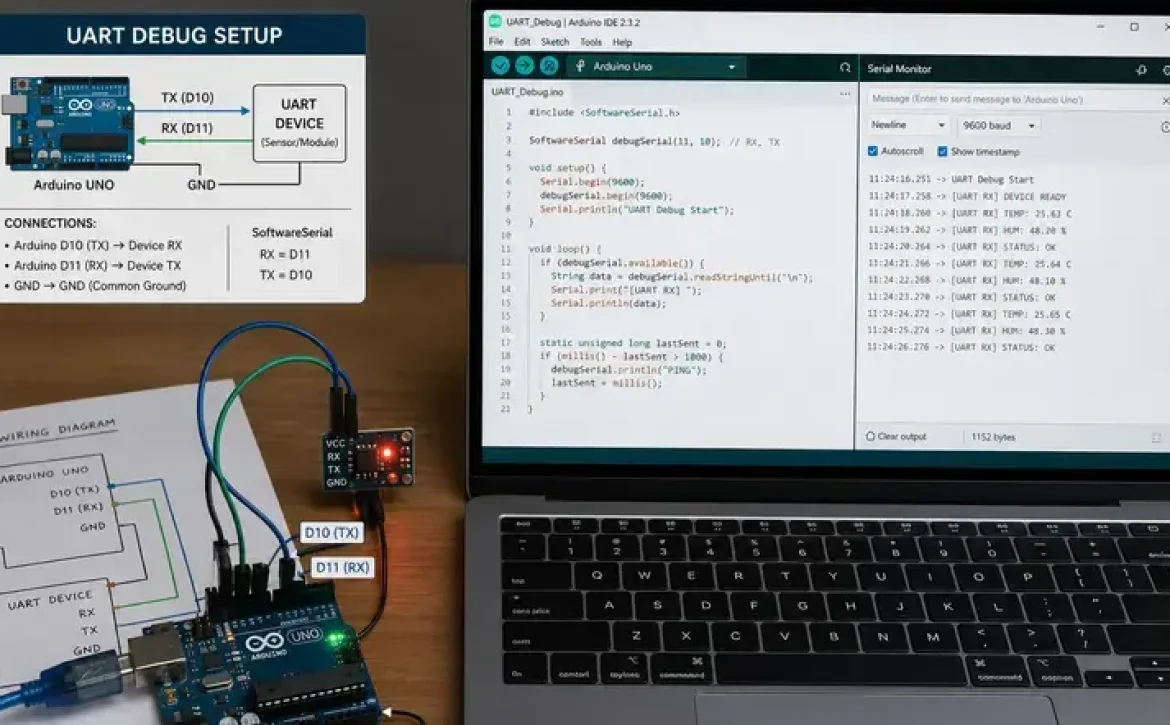
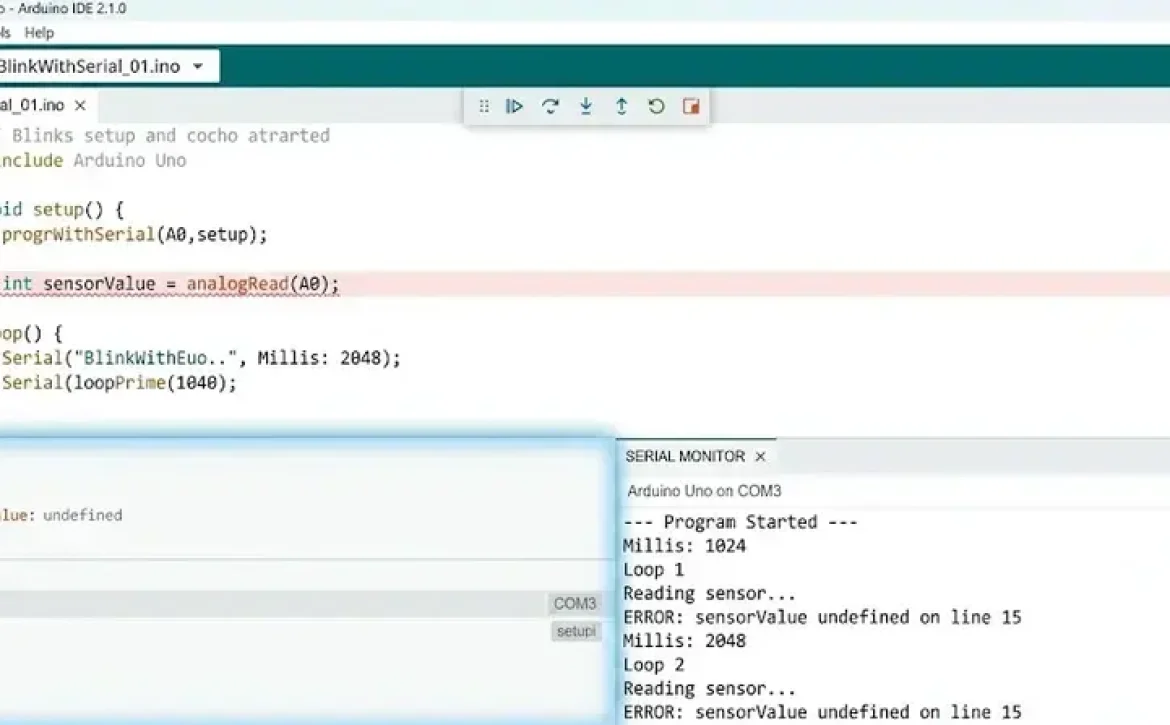
Batch file debug software commonly includes step execution, breakpoint monitoring, variable inspection, and logging features. These capabilities simplify troubleshooting in complex command-line workflows.

Common debugging techniques include:

  • Echo tracing using ECHO ON
  • Redirecting logs with >> logfile.txt
  • Variable state inspection
  • Error level testing using %ERRORLEVEL%
  • Command isolation for sequential verification
TechniquePurposeTypical Use
Echo DebuggingDisplays command executionScript tracing
ErrorLevel ChecksDetects command failuresConditional logic
Log RedirectionStores execution historyEnterprise automation
BreakpointsPauses script executionInteractive debugging

Popular tools include:

  • CMDebug
  • BatDBug
  • Visual Studio Code terminal debugging
  • Batch File Debugger projects on SourceForge

Many administrators discussing batch file debug software also compare batch script checker tools, CMD troubleshooting utilities, and PowerShell migration workflows.

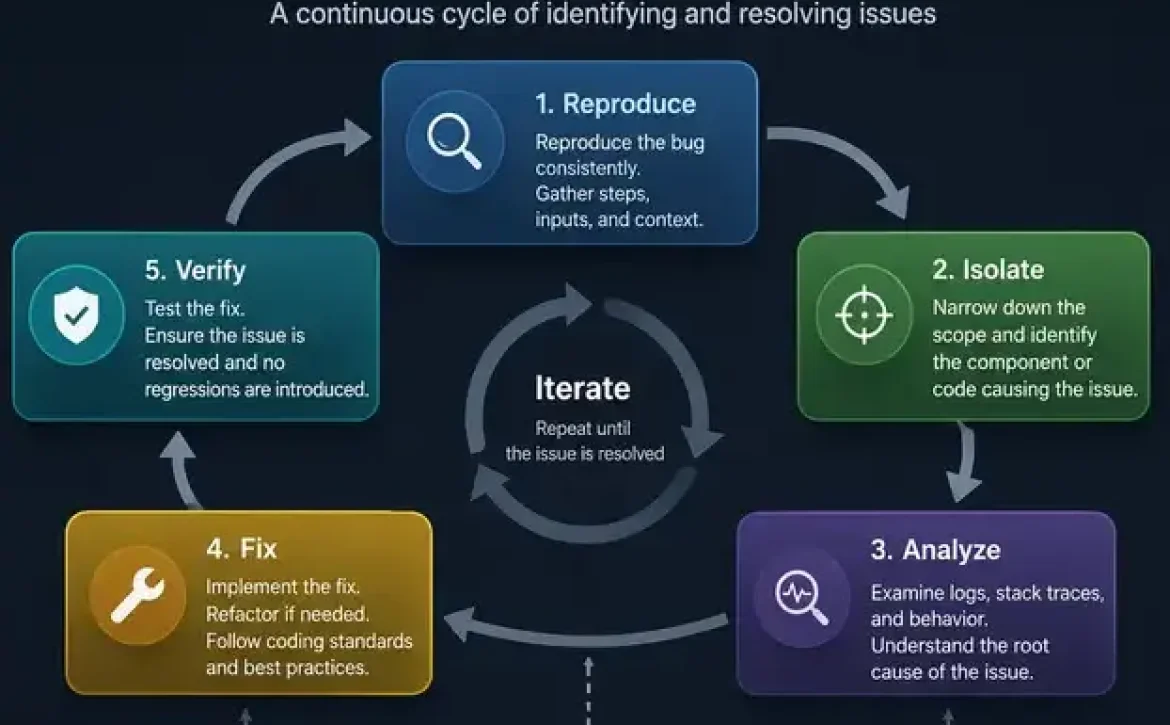
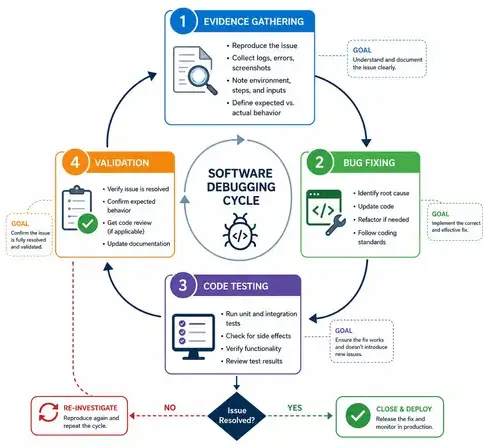
Process of Debugging in Software for Windows Batch Scripts

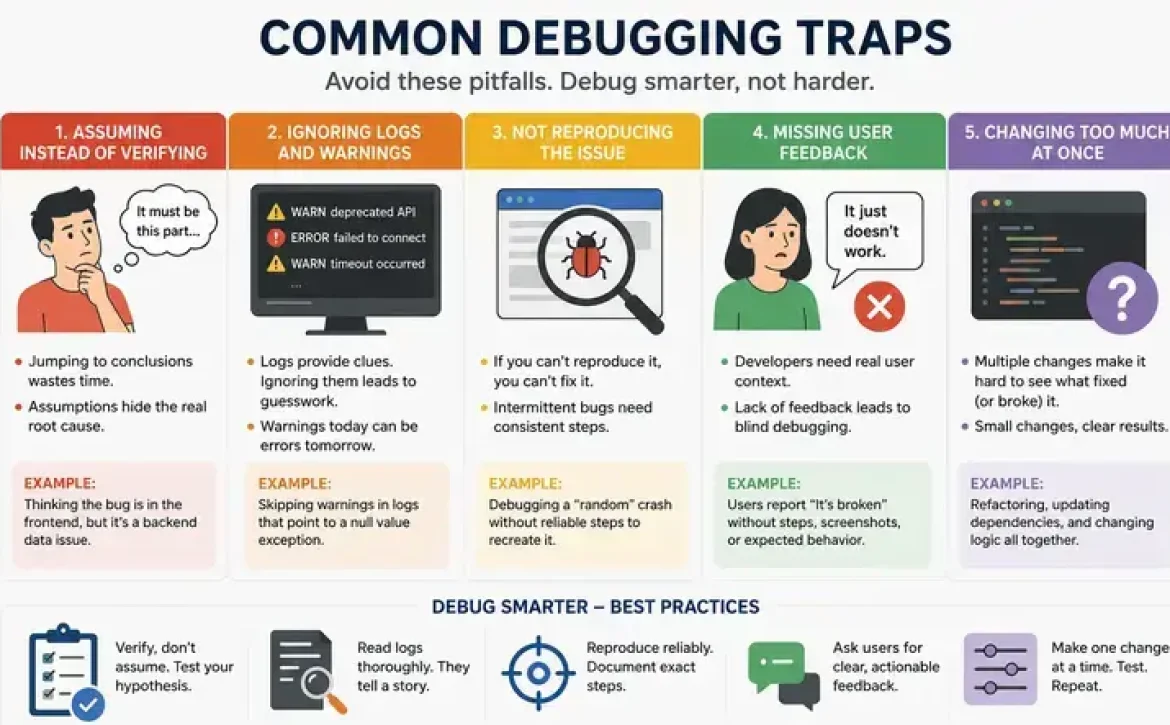
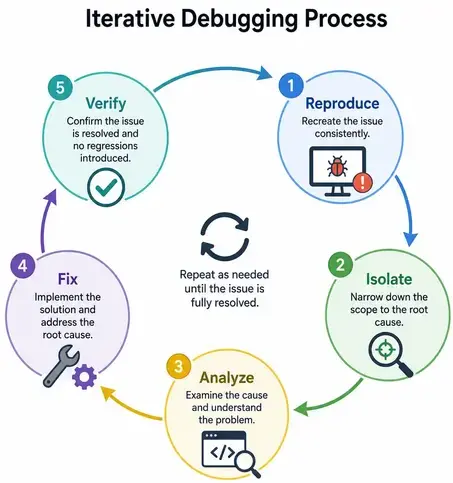
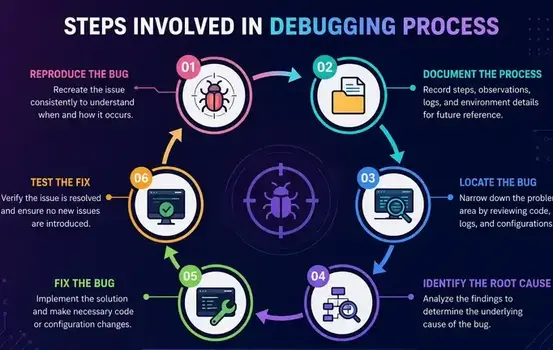
Batch file debug software for Windows 11 typically follows a structured troubleshooting process that improves execution consistency and reduces deployment failures.

Common Debugging Workflow

  1. Reproduce the batch script error
  2. Enable verbose command output
  3. Test commands independently
  4. Inspect variables and file paths
  5. Validate administrator permissions
  6. Review environment dependencies
  7. Re-run under controlled conditions

Frequent Batch Script Errors

Error TypeCauseExample
Path ErrorsIncorrect directory referencesMissing file paths
Syntax ErrorsInvalid command formattingBroken IF statements
Variable Expansion IssuesDelayed expansion conflictsLoop variables
Permission FailuresRestricted system accessRegistry edits

Windows administrators often use SETLOCAL ENABLEDELAYEDEXPANSION to troubleshoot variable parsing inside loops and conditional statements.

Programming Debug Software Methods for Detecting Batch File Errors

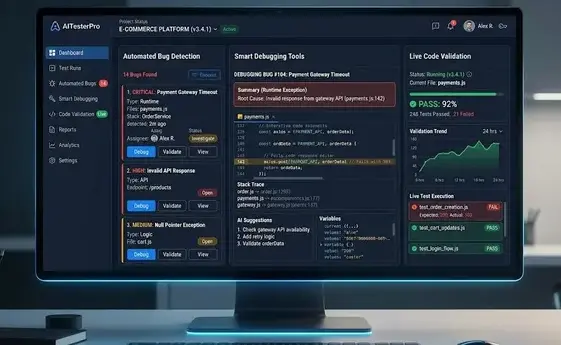
Batch file debug software helps developers identify execution failures before deployment into production environments.

Software Tools to Debug Scripts, JavaScript, and C++ Code

Modern development environments increasingly support mixed-language troubleshooting, allowing batch scripts to interact with JavaScript, PowerShell, Python, and compiled applications.

Important debugging features include:

  • Syntax highlighting
  • Inline error detection
  • Execution stepping
  • Environment simulation
  • Console monitoring

Commonly Used Batch Debugging Tools

ToolMain CapabilityPlatform
CMDebugInteractive batch debuggingWindows
BatDBugOpen-source batch debuggerWindows
VS CodeIntegrated terminal testingCross-platform
Quick Batch File CompilerScript packaging and testingWindows

Visual Studio Code can assist with Vscode debug batch file workflows through terminal execution and task automation extensions, although native breakpoint debugging for .bat files remains limited compared to compiled languages.

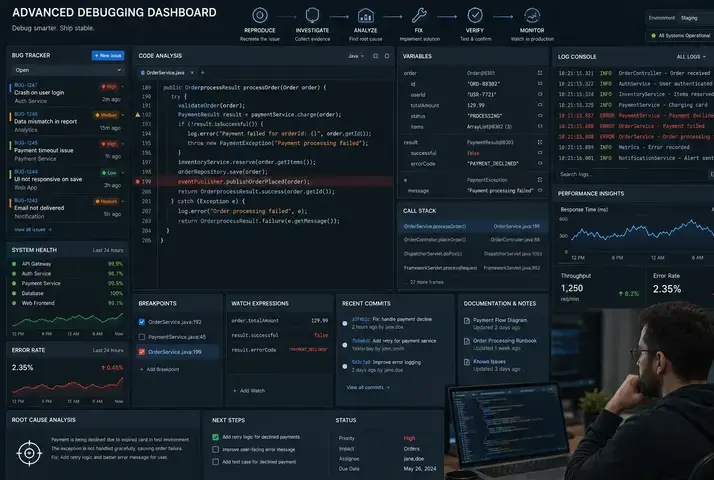
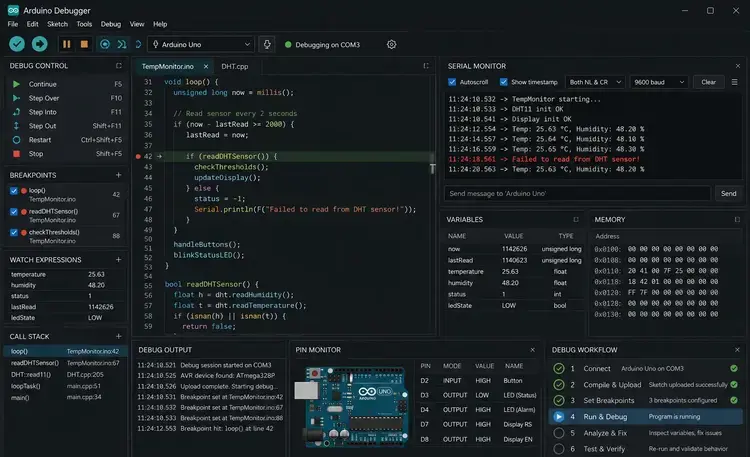
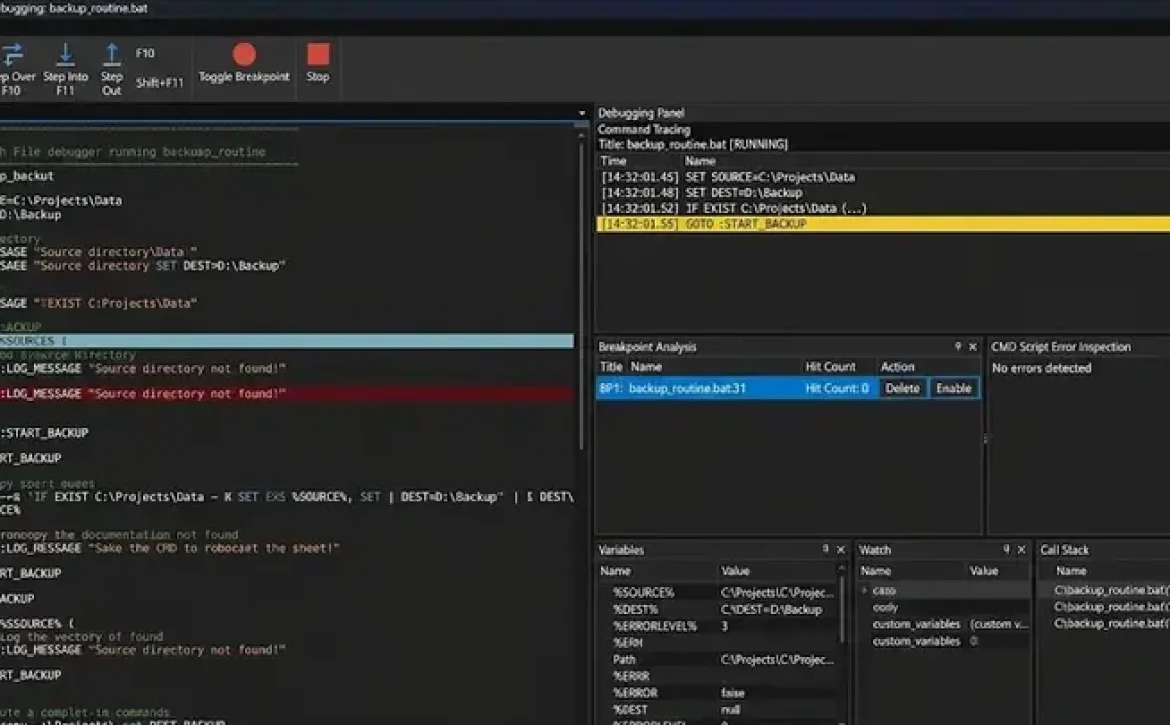
How Does CMDebug Improve Batch File Analysis?

CMDebug is a dedicated debugger for batch scripts developed to simplify command execution analysis.

Key features include:

  • Single-step execution
  • Breakpoint insertion
  • Variable monitoring
  • Call stack inspection
  • Syntax highlighting

CMDebug is commonly used in enterprise IT environments where legacy automation scripts remain critical for server administration and deployment management.

Why Is Batch File Debug Software Important for Windows 11?

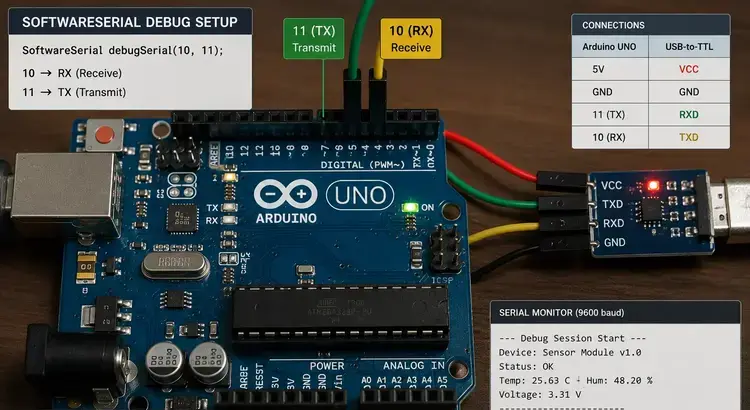
USB Debugging Software for Windows and PC Troubleshooting

Batch file debug software supports Windows 11 system maintenance by improving automation reliability and reducing administrative errors.

Practical applications include:

  • Network configuration scripts
  • Scheduled maintenance tasks
  • System backup automation
  • Driver deployment
  • USB device troubleshooting

Batch troubleshooting is sometimes integrated with USB debugging software for Windows when administrators automate hardware diagnostics or command-line recovery tasks.

Conclusion

Batch file debug software remains an important utility category for Windows automation, enterprise scripting, and administrative troubleshooting. Structured debugging methods, combined with specialized tools such as CMDebug and modern script editors, improve reliability, maintainability, and deployment accuracy across Windows environments.

Organizations maintaining legacy command-line workflows often combine these tools with related solutions such as back up or data recovery software that bypasses usb debugging to support broader recovery and troubleshooting operations.

FAQ

What is batch file debug software?

Batch file debug software is a utility that helps users identify and fix errors in Windows batch scripts through logging, tracing, and execution analysis.

Does Windows 11 support batch file debugging?

Yes. Windows 11 supports batch debugging through tools such as CMDebug, Visual Studio Code terminals, and command-line tracing methods.

Can Visual Studio debug BAT files?

Visual Studio and VS Code can execute and monitor BAT files, but advanced breakpoint debugging is usually provided by specialized batch debuggers.

What is the purpose of ErrorLevel in batch scripts?

%ERRORLEVEL% stores the exit status of commands and helps scripts detect execution failures for conditional processing.

Are batch scripts still used in enterprise environments?

Yes. Many organizations still use batch scripts for deployment automation, maintenance tasks, backup operations, and legacy system administration.

Sources

  • https://jpsoft.com/products/cmdebug.html
  • https://stackoverflow.com/questions/78534167/is-there-a-simple-debugger-for-batch-files
  • https://sourceforge.net/projects/batchdebugger/
  • https://github.com/Batch-Man/BatDBug
  • https://www.softpedia.com/get/Programming/Debuggers-Decompilers-Dissasemblers/CMDebug.shtml
  • https://softwarerecs.stackexchange.com/questions/51550/windows-batch-script-debugger-ide
  • https://www.reddit.com/r/Batch/comments/1hth5rw/consolelike_ide_for_batch_files/
  • https://www.capterra.in/software/1018882/quick-batch-file-compiler
READ MORE
Uncategorized
Umesh Kumar KhiriMay 21, 2026 0 Comments
Share article:TwitterFacebookLinkedin
12 Views
1 Like

back up or data recovery software that bypasses usb debugging: 7 Essential Recovery Methods

back up or data recovery software that bypasses usb debugging includes Android recovery applications, bootloader-based extraction tools, OTG access methods, and cloud synchronization utilities that help recover files without enabling developer-mode debugging. These tools are important when screens are broken, devices are locked, or internal storage cannot be accessed through standard Android Debug Bridge (ADB) connections. In many cases, recovery success depends on Android security settings, encryption status, and hardware condition.

Key Takeaways

  • Android recovery software can access files without standard ADB debugging in some scenarios.
  • Recovery success depends on encryption, hardware condition, and Android version.
  • OTG, fastboot, JTAG, and recovery mode are common access methods.
  • Free recovery tools often provide limited export functionality.
  • Enterprise recovery processes follow strict data security standards.

Software Debugging Tools and Techniques

USB Debugging Software Free Download

What types of software can recover data without USB debugging?

back up or data recovery software that bypasses usb debugging commonly uses alternative communication channels instead of ADB authorization. Most tools operate through recovery mode, custom drivers, OTG support, or cloud synchronization.

Common software categories include:

Software TypePrimary Function
Android recovery suitesRecover contacts, photos, SMS, and app files
OTG-based access toolsControl damaged devices using external input
Cloud synchronization toolsRestore files from Google Drive or Samsung Cloud
Bootloader recovery utilitiesExtract partitions from damaged systems
PC forensic toolsRead encrypted or partially damaged storage

Examples include:

  • Android Data Recovery
  • DroidKit
  • Dr.Fone
  • Samsung Smart Switch
  • ADB recovery environments

People also search for locked phone data recovery software, Android mobile data recovery online free, and free data recovery software for Android phone internal memory.

USB, Serial, and JTAG Debugging Software

USB Debugging Software for Windows

How does back up or data recovery software that bypasses usb debugging work?

back up or data recovery software that bypasses usb debugging typically accesses device storage through low-level hardware communication or recovery environments.

The recovery process usually follows these steps:

  1. Connect the Android device to a PC
  2. Detect storage partitions or recovery mode
  3. Use OEM drivers or chipset communication tools
  4. Scan internal memory sectors
  5. Export recoverable files

Some enterprise-grade tools also support:

  • Qualcomm EDL mode
  • JTAG extraction
  • Fastboot access
  • Custom recovery imaging

Common recovery interfaces

InterfacePurpose
USB OTGExternal mouse or keyboard control
FastbootBootloader communication
Recovery ModeFile extraction and reset operations
JTAGDirect hardware memory reading
Serial/UARTEmbedded device diagnostics

Software Testing, Validation, and Debugging Process

Software Used to Debug C++ Code

Which Android conditions affect recovery success?

back up or data recovery software that bypasses usb debugging performs differently depending on device state, encryption level, and operating system restrictions.

Recovery success is usually higher when:

  • The device powers on normally
  • Internal storage is not encrypted
  • OEM bootloader access is available
  • Cloud backup synchronization exists

Recovery success is lower when:

  • NAND memory is physically damaged
  • Full-disk encryption is enabled
  • FRP protection blocks access
  • The motherboard is defective

Android 10 and newer systems use stronger file-based encryption, which reduces unauthorized extraction capability.

What are the safest recovery methods for locked Android phones?

back up or data recovery software that bypasses usb debugging should prioritize non-destructive recovery methods before attempting firmware modification.

Recommended methods include:

  • Google account backup restoration
  • Samsung Smart Switch recovery
  • OTG mouse navigation
  • Manufacturer desktop recovery tools
  • SD card extraction

Avoid:

  • Unknown cracked recovery applications
  • Unverified APK installers
  • Rooting tools from unofficial forums
  • Software that disables Android security protections

Can free Android recovery tools fully restore deleted files?

back up or data recovery software that bypasses usb debugging may recover deleted files, but free versions usually provide limited scanning or preview functionality.

Typical free-tool limitations

LimitationImpact
Scan-only modeCannot export files
Partial recoveryMissing metadata
Device restrictionsLimited Android compatibility
Watermarked exportsReduced usability

Professional mobile repair centers often use licensed forensic platforms because they support encrypted storage analysis and damaged partition recovery.

What regulations and security standards apply to mobile recovery software?

back up or data recovery software that bypasses usb debugging may involve sensitive personal information, so organizations typically follow data protection regulations.

Relevant standards include:

  • GDPR data handling requirements
  • ISO/IEC 27001 security controls
  • Mobile device forensic chain-of-custody procedures
  • OEM warranty compliance policies

Businesses handling customer devices usually maintain:

  • Consent documentation
  • Secure recovery environments
  • Encrypted backup storage
  • Access audit logs

Conclusion

back up or data recovery software that bypasses usb debugging combines recovery utilities, hardware communication protocols, and storage extraction techniques to access Android data when standard debugging access is unavailable. As Android security systems continue evolving, recovery workflows increasingly depend on authorized backups, OEM recovery environments, and encrypted storage management.

For broader diagnostic workflows involving embedded systems and device communication analysis, related tools such as automotive debugging software are also commonly used in hardware-level troubleshooting environments.

FAQ

What is back up or data recovery software that bypasses usb debugging?

It is software designed to recover Android files without requiring USB debugging authorization through ADB.

Can data be recovered from a broken Android screen without USB debugging?

Yes. OTG adapters, cloud backups, recovery mode tools, and OEM recovery software may allow access.

Is Android data recovery software safe?

Licensed software from recognized vendors is generally safer than unofficial cracked applications or modified APKs.

Does factory reset remove recoverable data?

Factory reset often encrypts or overwrites storage references, significantly reducing recovery success rates.

Can USB debugging be enabled remotely?

In most Android devices, USB debugging must be manually authorized from the device interface for security reasons.

Sources

  • https://www.tataneu.com/pages/electronics/consumer-electronics/how-to-recover-data-without-usb-debugging-a-step-by-step-guide
  • https://sites.google.com/view/phone-data-recovery/recover-data-from-locked-android-with-broken-screen
  • https://android-data-recovery-free.en.softonic.com/
  • https://xdaforums.com/t/tool-adb-data-recovery-recover-data-from-a-phone-with-broken-screen.2339530/
  • https://www.imobie.com/android-recovery/recover-data-on-broken-android-without-usb-debugging.htm
  • https://apps.microsoft.com/detail/9ns48wwmp998
  • https://www.reddit.com/r/galaxyzflip/comments/1le25oi/guide_broken_screen_data_recovery_when_usb/
  • https://android.gadgethacks.com/news/android-usb-debugging-hidden-feature-could-save-your-data/
READ MORE
Uncategorized
Umesh Kumar KhiriMay 21, 2026 0 Comments
Share article:TwitterFacebookLinkedin
9 Views
0 Likes

automotive debugging software: 7 Powerful Tools and Diagnostic Methods

Automotive debugging software refers to specialized diagnostic and analysis tools used to detect software, firmware, and hardware issues in vehicle electronic systems. These tools support automotive engineers during ECU development, embedded testing, and communication protocol validation. As vehicles increasingly depend on connected and software-defined architectures, debugging platforms are essential for reliability, cybersecurity, and functional safety compliance.

Key Takeaways

  • Automotive debugging software supports ECU and embedded system diagnostics.
  • JTAG and hardware debuggers enable low-level firmware analysis.
  • TRACE32 and Lauterbach tools are widely used in automotive engineering.
  • CAN bus and embedded communication debugging are essential for vehicle reliability.
  • Structured debugging processes improve software validation and functional safety compliance.

What Is Automotive Debugging Software Used For?

Automotive debugging software is primarily used to monitor, test, and troubleshoot embedded vehicle systems. It enables engineers to inspect ECU behavior, analyze communication protocols, and validate software execution in real time.

Common applications include:

  • ECU firmware debugging
  • CAN, LIN, and FlexRay network analysis
  • Real-time trace monitoring
  • Embedded software validation
  • Functional safety verification
Automotive ComponentDebugging Purpose
ECUFault isolation and firmware analysis
CAN BusCommunication packet inspection
SensorsSignal verification
ADAS ModulesReal-time system testing
Infotainment SystemsSoftware performance diagnostics

Many engineers also compare related technologies such as debugging tools in embedded system environments, JTAG debugger interfaces, and hardware debugger platforms for low-level diagnostics.

Which Automotive Debugging Tools Are Commonly Used?

Automotive debugging software often includes hardware-assisted and software-based diagnostic tools.

SEGGER J Link Debug Pro

SEGGER J-Link Debug Pro supports ARM-based automotive microcontrollers and enables fast flash programming, breakpoint debugging, and real-time trace analysis.

Key features:

  • High-speed JTAG/SWD debugging
  • Embedded trace capture
  • RTOS-aware debugging
  • Automotive ECU compatibility

Lauterbach Debugger

The Lauterbach debugger is widely used for advanced automotive ECU development and AUTOSAR validation.

Typical capabilities include:

  • Multi-core debugging
  • Real-time trace analysis
  • ASIL-compliant development support
  • Complex SoC diagnostics

OpenOCD

OpenOCD is an open-source debugging framework used for embedded firmware testing and low-level hardware communication.

It supports:

  • JTAG and SWD interfaces
  • Flash programming
  • Remote debugging
  • Cross-platform development

How Does a JTAG Debugger Support Automotive Systems?

Automotive debugging software frequently relies on JTAG debugger interfaces for low-level hardware diagnostics. JTAG enables direct communication with microcontrollers and processors inside ECUs.

A JTAG debugging workflow generally includes:

  1. Connecting the debugger to the ECU
  2. Loading firmware symbols
  3. Setting breakpoints
  4. Monitoring memory registers
  5. Capturing execution traces

JTAG debugging is commonly used in:

  • Powertrain controllers
  • Battery management systems
  • ADAS modules
  • Vehicle gateway ECUs

What Is TRACE32 Debugger in Automotive Engineering?

What is TRACE32 debugger functionality in automotive development? TRACE32 is a professional debugging and trace platform developed by Lauterbach for embedded and multicore automotive systems.

TRACE32 supports:

  • Real-time program execution analysis
  • Multi-processor synchronization
  • AUTOSAR environment debugging
  • Hypervisor and RTOS inspection

It is frequently deployed in:

  • Autonomous driving systems
  • Electric vehicle control units
  • Advanced driver assistance systems
  • Safety-critical embedded platforms

Which Software Debugging Techniques Improve Vehicle Diagnostics?

Automotive debugging software relies on structured software debugging techniques to improve fault detection accuracy and system reliability.

Software Used to Debug C++ Code

Many automotive ECUs are programmed in C and C++. Debugging environments help engineers inspect variables, stack traces, and memory allocation errors.

Common techniques include:

  • Breakpoint analysis
  • Static code inspection
  • Runtime tracing
  • Memory leak detection

USB Debugging Software for Windows

USB debugging software for Windows is used for firmware flashing, serial communication monitoring, and hardware-level testing in embedded automotive devices.

Examples include:

  • Serial terminal tools
  • USB protocol analyzers
  • Device communication monitors

What Is the Process of Debugging in Software Development?

The process of debugging in software engineering follows a systematic sequence for fault identification and correction.

Testing and Debugging in Software Engineering

Testing and debugging in software engineering are closely linked during automotive software validation.

Typical debugging stages include:

  1. Error identification
  2. Fault reproduction
  3. Root cause analysis
  4. Code correction
  5. Regression testing
  6. System verification

Automotive manufacturers often combine debugging with:

  • Continuous integration testing
  • Simulation environments
  • Hardware-in-the-loop (HIL) testing
  • Functional safety validation

Conclusion

Automotive debugging software plays a critical role in ensuring reliable ECU operation, embedded system stability, and compliance with automotive safety standards. As vehicle architectures become more software-driven, structured debugging frameworks and hardware-assisted diagnostics will remain essential for efficient fault isolation and validation.

Modern engineering workflows increasingly integrate concepts from automated debugging in software engineering to improve traceability, reduce diagnostic time, and support scalable embedded development.

FAQs

What is automotive debugging software?

Automotive debugging software is a diagnostic platform used to identify and resolve faults in vehicle embedded systems, ECUs, and communication networks.

What is a hardware debugger?

A hardware debugger is a physical tool that connects to embedded processors and enables breakpoint analysis, memory inspection, and firmware tracing.

Why is JTAG debugging important in automotive systems?

JTAG debugging provides direct processor-level access for firmware testing, fault isolation, and real-time execution monitoring.

What does TRACE32 debugger do?

TRACE32 debugger analyzes embedded software execution, multicore processing behavior, and real-time trace data in automotive systems.

Which programming languages are commonly debugged in automotive ECUs?

C and C++ are the most commonly debugged programming languages in automotive embedded systems because of their low-level hardware control capabilities.

Sources

  • https://promwad.com/news/top-debugging-tools-embedded-systems-2025
  • https://www.linkedin.com/advice/0/how-can-you-use-software-debugger-electronic-wi3oc
  • https://ceur-ws.org/Vol-1531/paper5.pdf
  • https://www.lauterbach.com/industries/automotive
  • https://www.createq.com/en/software-engineering-hub/ai-debugging-tools
  • https://appinventiv.com/automotive-software-development-services/
  • https://www.swri.org/markets/electronics-automation/software/automotive-software
  • https://www.teledynelecroy.com/options/productseries.aspx?mseries=598&groupid=140
  • https://www.renesas.com/en/products/automotive-products/automotive-software-tools?srsltid=AfmBOorA-eblSMv12YdQZHOluaT2Co-6leQDvZdn7Xnz8ugeHEKqvtzg
READ MORE
Uncategorized
Umesh Kumar KhiriMay 21, 2026 0 Comments
Share article:TwitterFacebookLinkedin
13 Views
1 Like

Automated Debugging in Software Engineering: 7 Powerful Methods and Tools Explained

Automated debugging in software engineering is the process of using automated tools and diagnostic systems to detect, analyze, and resolve software defects with minimal manual intervention. It is widely used in web development, embedded systems, cloud platforms, and enterprise applications to improve software quality and reduce production failures. Modern debugging environments combine log analysis, breakpoint automation, static analysis, and testing frameworks to accelerate defect resolution.

Key Takeaways

  • Automated debugging improves software defect detection and resolution.
  • Static analysis and runtime analysis are widely used debugging techniques.
  • Debugging tools support enterprise, web, embedded, and cloud applications.
  • Software testing detects issues, while debugging resolves them.
  • Automated validation strengthens software reliability and deployment quality.

Software Debugging Techniques

What Are the Main Automated Debugging Techniques?

Automated debugging in software engineering commonly relies on structured debugging techniques that help developers isolate faults efficiently.

Key techniques include:

  • Static code analysis — scans source code without execution
  • Dynamic debugging — analyzes behavior during runtime
  • Log-based debugging — evaluates system-generated logs
  • Breakpoint automation — pauses execution at predefined states
  • Regression debugging — detects defects after code changes
  • AI-assisted defect localization — predicts probable fault locations

Common Debugging Approaches in Software Engineering

TechniquePurposeCommon Use Case
Static AnalysisDetect syntax and security issuesEnterprise applications
Runtime AnalysisObserve live executionCloud systems
Memory DebuggingIdentify leaks and corruptionC and C++ programs
Performance ProfilingAnalyze resource usageLarge-scale applications
Automated TestingValidate expected behaviorCI/CD pipelines

Related concepts often discussed alongside debugging include debugging types, software testing frameworks, and runtime validation methods.

How Does Automated Debugging Work in Real Software Systems?

Automated debugging in software engineering works by collecting execution data and comparing it against expected system behavior.

Typical workflow:

  1. Source code is scanned for defects
  2. Automated tests execute application functions
  3. Logs and runtime traces are analyzed
  4. Errors are classified by severity
  5. Developers receive diagnostic reports

Automated Debugging in Software Engineering Examples

Examples include:

  • Detecting memory leaks in C applications
  • Identifying failed API responses in web systems
  • Monitoring hardware communication faults in embedded devices
  • Locating concurrency issues in distributed cloud software

Organizations using DevOps pipelines often integrate automated debugging into continuous integration systems for faster deployment validation.

Hardware and Software Debugging Tools

What Hardware and Software Debugging Tools Are Commonly Used?

Automated debugging in software engineering depends heavily on specialized debugging tools.

Popular Debugging Tools in Software Engineering

Tool TypeExample Usage
IDE DebuggersVisual Studio Debugger
Embedded DebuggersJTAG, SWD tools
Browser DebuggersChrome DevTools
Static Analysis ToolsSonarQube
Log Monitoring PlatformsELK Stack
Performance ProfilersValgrind

These tools help developers inspect variables, trace execution flow, analyze memory allocation, and monitor system events.

What Is USB and Device Debugging Software?

USB and device debugging software is used to diagnose communication issues between hardware devices and operating systems.

Common applications include:

  • Embedded systems development
  • Android device debugging
  • Microcontroller diagnostics
  • Firmware validation

USB debugging software frequently supports serial monitoring, packet inspection, and driver-level diagnostics for hardware troubleshooting environments.

Which Software Is Used to Debug C++ and JavaScript Code?

Automated debugging in software engineering supports multiple programming languages through language-specific tools.

Software Used to Debug C++ and JavaScript Code

For C++

  • GDB
  • LLDB
  • Valgrind
  • Visual Studio Debugger

For JavaScript

  • Chrome DevTools
  • Node.js Inspector
  • Firefox Developer Tools

What Is Debugging in C?

Debugging in C focuses on identifying syntax errors, pointer faults, segmentation errors, memory leaks, and undefined behavior during program execution.

Software Testing, Validation, and Debugging

What Is the Difference Between Software Testing and Debugging?

Software testing verifies whether a program behaves correctly, while debugging identifies and fixes the causes of failures.

Software Testing vs Debugging

AspectTestingDebugging
ObjectiveDetect failuresFix failures
Performed ByTest engineersDevelopers
OutputBug reportsCorrected code
Automation LevelHighly automatedSemi-automated

Testing identifies defects, but debugging determines their root causes.

Why Is Automated Validation Important in Modern Development?

Automated validation improves software reliability by continuously checking system behavior against expected requirements.

Benefits include:

  • Faster defect detection
  • Reduced human error
  • Improved release stability
  • Better compliance with software quality standards
  • Scalable monitoring across large applications

Industries such as finance, healthcare, automotive systems, and telecommunications depend on automated validation for operational stability and regulatory compliance.

Conclusion

Automated debugging in software engineering has become essential for maintaining reliable and scalable software systems across enterprise, embedded, and cloud environments. Structured debugging techniques, specialized tools, and automated validation frameworks help organizations reduce failures, improve code quality, and accelerate software delivery cycles.

Modern development teams increasingly combine debugging, testing, and monitoring practices with integrated platforms such as auto debugging software to support continuous software reliability and long-term system maintenance.

FAQ

What is automated debugging in software engineering?

Automated debugging in software engineering uses software tools and diagnostic systems to detect, analyze, and help resolve defects automatically.

What are common debugging tools in software engineering?

Common tools include GDB, Valgrind, Chrome DevTools, Visual Studio Debugger, SonarQube, and embedded debugging interfaces like JTAG.

What is the difference between testing and debugging?

Testing identifies software defects, while debugging locates and fixes the underlying causes of those defects.

What is debugging in programming?

Debugging in programming is the process of identifying, analyzing, and correcting errors that affect software functionality or performance.

Why is automated debugging important?

Automated debugging improves software reliability, speeds up defect resolution, reduces manual effort, and supports continuous integration workflows.

Sources

  • https://www.betterbugs.io/blog/automated-debugging
  • https://www.geeksforgeeks.org/software-engineering/software-engineering-debugging/
  • https://www.meegle.com/en_us/topics/debugging/debugging-automation
  • https://www.computer.org/publications/tech-news/insider-membership-news/2026-harlan-automated-debugging
  • https://www.ibm.com/think/topics/debugging
  • https://www.lizard.global/en/blog/how-ai-is-transforming-quality-assurance-in-software-development-debugging-and-automated-testing
  • https://www.academia.edu/Documents/in/Automated_Debugging
  • https://dl.acm.org/doi/10.1145/2001420.2001445
  • https://www.asiaresearchnews.com/html/article.php/aid/9715/cid/2/research/technology/singapore_management_university/automatic_debugging_of_software.html
READ MORE
Uncategorized
Umesh Kumar KhiriMay 21, 2026 0 Comments
Share article:TwitterFacebookLinkedin
12 Views
0 Likes

Auto Debugging Software: 7 Powerful Tools and Techniques for Faster Error Detection

Auto debugging software is a category of development tools designed to automate error detection, code tracing, breakpoint analysis, and fault resolution in software applications. These tools help developers reduce manual debugging effort while improving code quality, testing efficiency, and system stability across complex software environments.

Key Takeaways

  • Auto debugging software automates software fault detection and analysis
  • Debugging differs from software testing in purpose and workflow
  • JTAG and USB debugging tools are widely used in embedded systems
  • Automated debugging reduces manual troubleshooting time
  • Modern debugging platforms support runtime tracing and root-cause analysis

What Is Software Debugging and Why Is It Important?

Auto debugging software improves software debugging by automating the identification of runtime errors, memory leaks, logic failures, and integration problems. Software debugging is important because unstable code can lead to security vulnerabilities, system crashes, and operational downtime.

Key Functions of Debugging

  • Identifying syntax and runtime errors
  • Monitoring application behavior
  • Tracing memory and CPU usage
  • Detecting failed dependencies
  • Validating software outputs

Industries such as automotive electronics, embedded systems, banking platforms, and cloud infrastructure rely heavily on debugging tools to maintain compliance and operational reliability.

Debugging AreaPurpose
Runtime AnalysisDetects execution failures
Memory DebuggingIdentifies leaks and corruption
Network DebuggingMonitors API and server communication
Embedded DebuggingTests firmware and hardware interactions

Some users also compare auto debugging software with debugging AI tools, AI-assisted debugging, ChatDBG platforms, and JTAG debugger software for embedded development.

Best Software Debugging Tools and Techniques for Developers

Auto debugging software solutions vary depending on programming language, system architecture, and deployment environment. Modern tools combine automated diagnostics, log analysis, and intelligent breakpoint management.

Common Debugging Tools

  1. ChatDBG for conversational debugging workflows
  2. JTAG debugger software for embedded systems
  3. Browser-based debugging platforms for web applications
  4. AI debugger systems for automated root-cause analysis
  5. Auto Debug Professional for Windows-based debugging environments

Popular Debugging Techniques

  • Step-by-step execution tracing
  • Stack trace analysis
  • Automated breakpoint insertion
  • Remote debugging
  • Regression debugging

Many organizations now use auto debugging software free editions during development before moving to enterprise-grade commercial platforms.

Software Testing and Debugging: Key Differences Explained

Auto debugging software supports debugging activities, while software testing focuses on validating expected software behavior. Testing identifies the existence of defects, whereas debugging isolates and fixes the root cause.

Software TestingSoftware Debugging
Detects defectsFixes defects
Performed by QA teamsPerformed by developers
Uses test casesUses debugging tools
Validates functionalityAnalyzes code behavior

Testing methods include unit testing, integration testing, and system testing, while debugging relies on execution monitoring and fault isolation.

Software Testing vs Debugging: Core Differences

Software testing verifies whether software behaves according to requirements. Debugging begins after a defect is identified and focuses on locating the exact source of failure.

For example:

  • A failed login test is a testing issue
  • Investigating authentication logic causing the failure is debugging

Best USB Debugging Software for Windows PCs

USB debugging software is commonly used for Android development, firmware flashing, and device diagnostics on Windows systems.

Important Features Include

  • Device communication monitoring
  • ADB command integration
  • USB driver diagnostics
  • Remote shell access
  • Real-time log collection

Popular platforms often support Android SDK tools, embedded debugging environments, and hardware diagnostics.

What Is the Debugging Process in Software Testing?

The debugging process in software testing follows a structured workflow designed to isolate and resolve software defects efficiently.

Typical Debugging Steps

  1. Reproduce the issue
  2. Analyze logs and stack traces
  3. Identify faulty code sections
  4. Apply corrective changes
  5. Retest the application
  6. Validate system stability

This process is critical in large-scale systems where software failures can affect user security, transaction processing, or embedded device performance.

Conclusion

Auto debugging software continues to improve software reliability by automating error detection, execution tracing, and fault resolution across modern development environments. As systems become more complex, structured debugging frameworks and automated diagnostics will remain essential for scalable software engineering and quality assurance workflows.

Organizations integrating automated debugging alongside artificial intelligence for software testing and debugging can improve defect resolution speed, reduce downtime, and strengthen software validation processes.

FAQ

What is auto debugging software?

Auto debugging software is a tool that automatically detects, analyzes, and helps resolve software errors during development and testing.

How does auto debugging software work?

It monitors program execution, analyzes logs, detects abnormal behavior, and identifies the source of software failures.

Is debugging the same as software testing?

No. Testing identifies defects, while debugging focuses on locating and fixing the root cause of those defects.

What is JTAG debugger software used for?

JTAG debugger software is used in embedded systems to test firmware, inspect hardware behavior, and diagnose low-level system errors.

Are free auto debugging software tools available?

Yes. Many platforms offer free debugging editions with features such as breakpoint analysis, log tracing, and runtime monitoring.

Sources

  • https://graphite.com/guides/ai-powered-debugging-tools
  • https://www.braintrust.dev/articles/best-ai-agent-debugging-tools-2026
  • https://www.autodebug.com/
  • https://www.lauterbach.com/industries/automotive
  • https://auto-debug-professional.apponic.com/
  • https://www.createq.com/en/software-engineering-hub/ai-debugging-tools
  • https://www.browserstack.com/guide/ai-debugging-tools
  • https://medium.com/@akashnagpal112/24-best-debugging-tools-for-developers-in-2026-d5e34cee5880
  • https://www.lizard.global/en/blog/how-ai-is-transforming-quality-assurance-in-software-development-debugging-and-automated-testing
READ MORE
Uncategorized
Umesh Kumar KhiriMay 21, 2026 0 Comments
Share article:TwitterFacebookLinkedin
16 Views
0 Likes

Artificial Intelligence for Software Testing and Debugging: 7 Powerful Industry Applications

Artificial intelligence for software testing and debugging refers to the use of intelligent automation and data-driven systems to identify software defects, improve test coverage, and accelerate debugging activities. Modern software environments generate large volumes of code, logs, and test cases, making automated analysis increasingly important. Organizations in finance, healthcare, automotive, and cloud computing use these technologies to improve reliability, compliance, and release efficiency.

Key Takeaways

  • Artificial intelligence improves software testing efficiency and debugging accuracy.
  • Automated systems help detect defects earlier in development cycles.
  • Debugging focuses on fixing defects, while testing focuses on identifying them.
  • Intelligent testing tools support DevOps and continuous integration workflows.
  • Structured debugging processes improve software reliability and compliance.

Software Testing and Debugging Techniques

Artificial intelligence for software testing and debugging improves testing techniques by automating repetitive validation tasks and identifying defect patterns faster than traditional manual methods.

Software Testing vs Debugging: Key Differences Explained

Software testing verifies whether software meets functional and performance requirements, while debugging identifies and fixes the root causes of failures.

AspectSoftware TestingDebugging
Primary GoalDetect defectsFix defects
Performed ByQA engineers, testersDevelopers
Process TypeValidationRoot-cause analysis
OutputTest reportsCorrected code

Common testing approaches include:

  • Unit testing
  • Integration testing
  • Regression testing
  • Performance testing
  • Security testing

Debugging methods often include:

  • Log analysis
  • Breakpoint tracing
  • Static code analysis
  • Memory inspection
  • Automated anomaly detection

A related area often discussed with this topic includes AI-powered software testing, free AI tools for software testing, and software testing in the AI era.

Testing and Debugging in Software Engineering

Testing and debugging in software engineering support continuous integration and continuous delivery pipelines. Many organizations integrate intelligent testing systems into DevOps environments to reduce deployment failures.

Industry practices include:

  1. Automated regression testing during every build
  2. Predictive defect analysis using historical bug data
  3. Intelligent prioritization of high-risk code sections
  4. Automated generation of test cases from user behavior

Standards such as ISO/IEC/IEEE 29119 for software testing provide structured guidance for test documentation and execution.

What Is the Debugging Process in Software Testing?

The debugging process in software testing involves identifying, isolating, analyzing, and correcting software defects after failures are detected.

Typical debugging stages include:

  1. Reproducing the defect
  2. Collecting logs and diagnostic data
  3. Isolating the affected module
  4. Identifying root causes
  5. Implementing fixes
  6. Retesting the application

Modern debugging systems can automatically correlate crash logs, runtime anomalies, and historical defect patterns to reduce investigation time.

Software Debugging Tools

Artificial intelligence for software testing and debugging relies on advanced debugging platforms that support automated code inspection, monitoring, and fault prediction.

Popular categories of debugging tools include:

Tool CategoryPrimary Function
Static Analysis ToolsDetect code vulnerabilities
Runtime Monitoring ToolsAnalyze live application behavior
Automated Test PlatformsExecute repetitive test scenarios
Error Tracking SystemsCapture and classify failures
Log Management ToolsCentralize debugging information

Commonly used enterprise tools include:

  • Selenium-based automation frameworks
  • JUnit and TestNG
  • SonarQube
  • Postman testing environments
  • AI-assisted bug tracking platforms

These tools improve productivity by reducing manual inspection workloads and increasing test accuracy across large codebases.

Importance of Debugging in Software Development

Artificial intelligence for software testing and debugging strengthens software reliability by reducing production failures and improving system stability.

Key benefits include:

  • Faster defect detection
  • Reduced software downtime
  • Improved customer experience
  • Better regulatory compliance
  • Increased release confidence

Industries such as healthcare, aerospace, and automotive depend on rigorous debugging because software failures may create operational or safety risks. Intelligent testing systems also support secure software development practices by identifying vulnerabilities earlier in the development lifecycle.

Organizations increasingly use predictive analytics to estimate defect-prone modules before deployment, helping teams prioritize testing resources more effectively.

Conclusion

Artificial intelligence for software testing and debugging continues to transform software quality assurance through automated analysis, predictive defect detection, and intelligent debugging workflows. As software systems become more complex, structured testing classifications and advanced debugging strategies will remain essential for maintaining reliability and compliance.

For broader technical context, readers exploring advanced quality assurance workflows may also benefit from understanding the art of debugging process in software engineering and its role in modern development environments.

FAQ

What is artificial intelligence for software testing and debugging?

It is the use of intelligent automation and data analysis systems to improve software testing accuracy, defect detection, and debugging efficiency.

How does AI improve software testing?

AI improves software testing by automating repetitive tasks, generating test cases, predicting defects, and analyzing large testing datasets faster.

What are the benefits of AI-powered software testing?

Benefits include reduced testing time, improved defect detection accuracy, better regression testing, and faster software releases.

Which industries use AI for software testing and debugging?

Industries such as finance, healthcare, automotive, aerospace, telecommunications, and cloud computing commonly use these technologies.

Can AI replace human software testers?

AI assists software testers by automating repetitive processes, but human expertise remains essential for exploratory testing, validation, and decision-making.

Sources

  • https://teo.dk/en/the-role-of-ai-in-software-testing-and-debugging-transforming-the-qa-process/
  • https://www.aeologic.com/blog/the-role-of-ai-in-automating-software-testing-and-debugging/
  • https://www.aspiresys.com/blog/software-testing-services/test-automation/what-transformative-role-ai-plays-in-software-testing-and-debugging/
  • https://qase.io/blog/ai-in-software-testing/
  • https://testgrid.io/blog/ai-in-software-testing/
  • https://www.lizard.global/en/blog/how-ai-is-transforming-quality-assurance-in-software-development-debugging-and-automated-testing
  • https://www.vibidsoft.com/blog/ai-powered-tools-for-debugging-and-testing-in-software-development-a-complete-guide/
  • https://www.inflectra.com/Ideas/Entry/ai-software-development-1532.aspx
  • https://www.kualitee.com/blog/ai/role-of-ai-in-software-testing-enhancing-efficiency-and-accuracy/
READ MORE
Uncategorized
Umesh Kumar KhiriMay 20, 2026 0 Comments
Share article:TwitterFacebookLinkedin
11 Views
0 Likes

Art of Debugging Process in Software Engineering: 7 Powerful Techniques and Practical Methods

The art of debugging process in software engineering is the structured practice of detecting, isolating, analyzing, and fixing software errors during development and testing. Debugging helps developers improve application reliability, maintainability, and performance while reducing system failures and operational risks. Effective debugging combines technical analysis, testing procedures, logging systems, and diagnostic tools to locate defects efficiently.

Key Takeaways

  • Debugging is essential for software reliability and defect correction.
  • Structured debugging processes improve development efficiency.
  • Testing identifies defects, while debugging fixes them.
  • Automated debugging tools accelerate enterprise software maintenance.
  • Industries with safety-critical systems require rigorous debugging standards.
  • Regression testing helps prevent recurring software failures.

Software Debugging Techniques

What are the most effective software debugging techniques?

The art of debugging process in software engineering relies on proven debugging techniques that help developers isolate faults and correct them systematically.

Common software debugging techniques include:

  • Brute Force Debugging
    • Uses logs, memory dumps, and print statements
    • Common in small-scale applications
  • Backtracking
    • Traces program execution backward from the failure point
    • Useful for logic and runtime errors
  • Cause Elimination
    • Removes suspected causes through testing
    • Often combined with binary search methods
  • Program Slicing
    • Focuses only on code sections affecting a variable or output
    • Reduces debugging complexity
  • Automated Debugging
    • Uses integrated debugging tools and monitoring software
    • Common in enterprise DevOps pipelines
TechniquePrimary UseExample
BacktrackingLogic errorsIncorrect calculations
Program SlicingVariable trackingData corruption issues
Automated DebuggingLarge systemsCloud applications
Cause EliminationComplex bugsAPI integration failures

A mobile application crash caused by null pointer exceptions can often be resolved through log analysis and breakpoint inspection inside integrated development environments.

Process of Debugging in Software

What is the standard process of debugging in software?

The art of debugging process in software engineering follows a structured workflow to reduce repeated failures and improve software quality.

Standard debugging process

  1. Identify the Error
    • Detect abnormal behavior or system failure
  2. Reproduce the Problem
    • Repeat the issue consistently
  3. Analyze the Root Cause
    • Inspect logs, variables, dependencies, and execution flow
  4. Develop a Fix
    • Modify faulty logic or configuration
  5. Test the Solution
    • Verify the defect no longer exists
  6. Perform Regression Testing
    • Ensure other features remain unaffected
  7. Document the Issue
    • Record the bug, fix, and preventive actions

For example, in embedded systems, debugging may involve hardware monitoring, firmware analysis, and serial communication testing.

People often explore related areas such as debugging tools in software engineering, software testing methods, and what is debugging in programming when studying defect management workflows.

Importance of Debugging in Software Development

Why is debugging important in software development?

The art of debugging process in software engineering directly impacts software stability, cybersecurity, compliance, and customer experience.

Key benefits of debugging

  • Improves software reliability
  • Reduces application downtime
  • Prevents security vulnerabilities
  • Enhances user experience
  • Supports regulatory compliance
  • Lowers maintenance costs

Industries such as healthcare, aviation, banking, and automotive systems rely heavily on debugging because software defects can create operational and safety risks.

Software Testing vs Debugging

The art of debugging process in software engineering differs from software testing because testing identifies defects while debugging fixes them.

Software TestingDebugging
Detects errorsCorrects errors
Performed by testersPerformed by developers
Focuses on validationFocuses on root cause analysis
Uses test casesUses debugging tools

Testing determines whether a defect exists, while debugging determines why the defect exists.

Testing and Debugging in Software Engineering

The art of debugging process in software engineering works closely with software testing throughout the development lifecycle.

Common testing stages linked with debugging

  • Unit Testing
  • Integration Testing
  • System Testing
  • Acceptance Testing
  • Regression Testing

Modern development environments integrate testing and debugging through automated pipelines, continuous integration systems, and monitoring platforms.

What Is Debugging Process in Software Testing

The art of debugging process in software engineering supports software testing by helping teams isolate failed test conditions and repair defective logic.

During software testing, debugging usually includes:

  • Reading execution logs
  • Inspecting variables
  • Setting breakpoints
  • Monitoring memory allocation
  • Verifying output consistency

Debugging tools such as GDB, Visual Studio Debugger, Eclipse Debugger, and Chrome DevTools are commonly used in professional software environments.

Conclusion

The art of debugging process in software engineering combines structured analysis, testing practices, and technical tools to improve software quality and operational reliability. Organizations that apply systematic debugging frameworks reduce defects, improve maintainability, and strengthen application security across development environments.

For embedded and hardware-level troubleshooting workflows, topics such as arduino software serial debug also provide practical insight into serial communication analysis and runtime diagnostics.

FAQ

What is the art of debugging in software engineering?

The art of debugging in software engineering is the systematic process of finding, analyzing, and fixing software defects to improve application performance and reliability.

What are the 7 steps of software testing?

The seven common steps include requirement analysis, test planning, test case design, environment setup, test execution, defect tracking, and test closure.

What is the software debugging process?

The software debugging process involves identifying errors, reproducing defects, analyzing causes, fixing code issues, testing solutions, and documenting results.

How many types of debugging are there?

Common debugging types include brute force debugging, backtracking, cause elimination, program slicing, and automated debugging.

What tools are used for debugging in software engineering?

Popular debugging tools include GDB, Visual Studio Debugger, Eclipse Debugger, WinDbg, Chrome DevTools, and integrated IDE debugging systems.

Sources

  • https://www.geeksforgeeks.org/software-engineering/software-engineering-debugging/
  • https://dev.to/arjun98k/the-art-of-debugging-in-software-engineering-33gg
  • https://www.tricentis.com/learn/debugging
  • https://www.meegle.com/en_us/topics/debugging/debugging-in-software-engineering
  • https://www.slideshare.net/slideshow/the-art-of-debuggingpptx/253809890
  • https://sestudies.hashnode.dev/the-art-and-science-of-debugging-in-software-engineering
  • https://codegama.com/blog/the-art-of-debugging-tips-and-techniques-for-effective-troubleshooting/
  • https://www.scribd.com/document/901432274/THE-ART-OF-DEBUGGING
  • https://www.vinove.com/blog/guides-and-tutorials/mastering-the-art-of-debugging-a-guide/
READ MORE
Uncategorized
Umesh Kumar KhiriMay 20, 2026 0 Comments
Share article:TwitterFacebookLinkedin
10 Views
0 Likes

Arduino Software Serial Debug: 7 Powerful Methods for Reliable Serial Communication

Arduino software serial debug is the process of testing, monitoring, and troubleshooting serial communication implemented through the Arduino SoftwareSerial library. The method allows developers to create additional serial ports using digital pins instead of dedicated hardware UART pins. It is commonly used in embedded systems that require communication with GPS modules, Bluetooth devices, GSM modules, and serial sensors while maintaining stable debugging output.

Key Takeaways

  • Arduino software serial debug enables extra UART communication using digital pins
  • SoftwareSerial is useful for GSM, GPS, Bluetooth, and sensor modules
  • Lower baud rates improve debugging reliability
  • Logic analyzers and serial monitors help diagnose communication issues
  • Hardware UART remains more stable than software-emulated serial communication
  • Proper interrupt management reduces data corruption risks

Programming Debug Software

What Is Arduino Software Serial Debug in Programming Applications?

Arduino software serial debug is commonly used in programming debug software to inspect transmitted and received UART data during embedded application development. The SoftwareSerial library emulates serial communication through configurable digital pins.

Common applications include:

  • GPS communication debugging
  • GSM module troubleshooting
  • Bluetooth HC-05 monitoring
  • Sensor data verification
  • IoT device diagnostics

Example configuration:

#include <SoftwareSerial.h>

SoftwareSerial mySerial(10, 11);

void setup() {
  Serial.begin(9600);
  mySerial.begin(9600);
}

This setup creates a secondary serial channel using pins 10 and 11.

USB Debugging Software for Windows

Windows-based Arduino IDE tools allow developers to monitor software serial communication through USB-connected Serial Monitor interfaces.

Typical tools include:

ToolFunction
Arduino IDE Serial MonitorReal-time serial output
PuTTYExternal serial terminal
Tera TermUART debugging
Visual MicroAdvanced debugging integration

Serial Debugging Software

How Does Arduino Software Serial Debug Work?

Arduino software serial debug works by emulating UART communication in software rather than using dedicated hardware serial peripherals. The library manages timing-sensitive RX and TX operations through interrupt-driven communication.

Important characteristics include:

  1. Only one software serial port can listen at a time
  2. High baud rates may reduce reliability
  3. Timing conflicts can occur with interrupts
  4. Boards with multiple hardware UARTs often perform better

Supported baud rates generally include:

  • 9600
  • 19200
  • 38400
  • 57600

Lower baud rates are usually more stable for debugging.

Software Tools Debug Monitor

A debug monitor helps visualize transmitted data and detect communication failures.

Useful debugging indicators include:

  • Garbled characters
  • Missing packets
  • Baud mismatch errors
  • Buffer overflow warnings

Example debug output:

mySerial.println(“Sensor Active”);

Developers often discuss Arduino software serial debug alongside Arduino code debugger online tools, SoftwareSerial examples, and serial monitor configuration methods for embedded troubleshooting.

Hardware and Software Debugging Tools

Which Hardware and Software Tools Improve Arduino Software Serial Debug?

Arduino software serial debug becomes more reliable when supported by dedicated hardware and software debugging tools.

Common hardware tools:

ToolPurpose
Logic AnalyzerSignal timing inspection
USB-to-TTL AdapterExternal UART monitoring
OscilloscopeWaveform analysis
FTDI ModuleSerial communication testing

Common software tools:

  • Arduino IDE 2 Serial Monitor
  • Serial Plotter
  • Visual Micro Debugger
  • SerialDebug GitHub library

Software Used to Debug C++ Code

Because Arduino sketches are primarily written in C++, debugging practices follow standard embedded C++ development principles.

Recommended methods include:

  • Serial print debugging
  • Conditional debug macros
  • Non-blocking logging
  • Watch variable inspection
  • Incremental module testing

Example debug macro:

#define DEBUG 1

#if DEBUG
  Serial.println(“Debug Enabled”);
#endif

What Are Common Arduino Software Serial Debug Problems?

Arduino software serial debug may experience communication instability due to timing limitations and CPU interrupt conflicts.

Frequent issues include:

ProblemCause
Missing dataInterrupt timing conflicts
Random charactersIncorrect baud rate
Serial freezingBuffer overflow
Communication delayCPU overload

Best practices for stability:

  • Use lower baud rates
  • Avoid excessive Serial.print statements
  • Limit simultaneous interrupts
  • Prefer hardware UART when available
  • Separate debug and communication channels

How Do You Install the SoftwareSerial Library in Arduino?

Most Arduino IDE versions already include the SoftwareSerial library by default.

Manual installation steps:

  1. Open Arduino IDE
  2. Select Sketch
  3. Choose Include Library
  4. Open Manage Libraries
  5. Search for “SoftwareSerial”
  6. Install or update the library

After installation, include:

#include <SoftwareSerial.h>

Conclusion

Arduino software serial debug provides a flexible method for monitoring UART communication when hardware serial ports are limited. Stable debugging depends on correct baud configuration, controlled interrupt usage, and proper diagnostic tools.

As embedded applications continue expanding across IoT and automation systems, combining SoftwareSerial techniques with structured diagnostic practices improves communication reliability and maintainability. Developers working with advanced embedded troubleshooting may also benefit from understanding related concepts in arduino debugging software for broader diagnostic workflows.

FAQ

What is Arduino software serial debug?

Arduino software serial debug is the process of troubleshooting serial communication created through the SoftwareSerial library using digital pins instead of hardware UART pins.

Is SoftwareSerial slower than hardware serial?

Yes. SoftwareSerial relies on CPU timing and interrupts, making it less efficient and less reliable at high baud rates compared to hardware UART.

Which baud rate is best for Arduino software serial debug?

9600 baud is commonly recommended because it provides stable communication in most embedded debugging scenarios.

Can SoftwareSerial work on all Arduino boards?

Most Arduino boards support SoftwareSerial, but boards with multiple hardware UARTs often provide better performance for debugging tasks.

Why does SoftwareSerial show garbled text?

Garbled text usually occurs because of mismatched baud rates, interrupt conflicts, or unstable signal timing.

Sources

  • https://docs.arduino.cc/learn/microcontrollers/debugging/
  • https://www.arduino.cc/en/Reference/softwareSerial
  • https://docs.arduino.cc/software/ide-v2/tutorials/ide-v2-serial-monitor
  • https://github.com/JoaoLopesF/SerialDebug
  • https://forum.arduino.cc/t/serial-monitor-debug-software-serial-communication/971668
  • https://www.visualmicro.com/post/2012/05/06/Configure-debug-for-other-types-of-serial-transport
  • https://wiki.seeedstudio.com/Software-Serial/
  • https://forum.arduino.cc/t/managing-serial-print-as-a-debug-tool/1024824
READ MORE
Uncategorized
Umesh Kumar KhiriMay 20, 2026 0 Comments
Share article:TwitterFacebookLinkedin
13 Views
1 Like

Arduino Debugging Software: 7 Powerful Tools and Methods for Reliable Code Testing

Arduino debugging software is a collection of software and hardware utilities used to detect, analyze, and resolve programming or circuit-related issues in Arduino-based systems. It supports developers working with serial communication, sensors, ESP32 boards, STM32 microcontrollers, and embedded C++ applications. Effective debugging reduces system failures, improves code reliability, and helps validate real-time hardware behavior.

Key Takeaways

  • Arduino debugging software helps diagnose coding and hardware issues.
  • Serial Monitor remains the most widely used debugging method.
  • ESP32 and STM32 boards support advanced debugging features.
  • Arduino Uno has limited native debugging capabilities.
  • Hardware tools such as JTAG and SWD improve troubleshooting accuracy.
  • Arduino IDE 2.x introduced improved debugging support.

Software Debugging Tools

STM32 Debugging Software and What Is Arduino Debugging Software Used For?

Arduino debugging software is used to monitor code execution, inspect variables, test communication protocols, and troubleshoot hardware interactions. Most Arduino projects use serial debugging through the Arduino IDE, while advanced boards support hardware debugging interfaces.

Common uses include:

  • Detecting syntax and logic errors
  • Monitoring sensor output values
  • Testing serial communication
  • Validating PWM and GPIO behavior
  • Troubleshooting ESP32 and STM32 firmware
Debugging MethodPrimary UseSupported Boards
Serial MonitorText-based debuggingMost Arduino boards
SWD/JTAG DebuggingReal-time hardware debuggingSTM32, ESP32
BreakpointsStep-by-step executionAdvanced IDE tools
Logic AnalyzerSignal monitoringExternal hardware

Arduino debugging software free download options are commonly available through the Arduino IDE ecosystem and open-source debugging utilities.

Hardware and Software Debugging Tools

Software Used to Debug C++ Code and How Does Arduino IDE Support Debugging?

Arduino debugging software includes both software-based and hardware-assisted tools. The selection depends on board compatibility and project complexity.

Popular tools include:

  1. Arduino IDE Serial Monitor
  2. GDB Debugger
  3. PlatformIO Debugger
  4. OpenOCD
  5. J-Link Debug Probes
  6. ESP-Prog Debugger
  7. STM32CubeIDE Debugger

Many users also search for Arduino debugger solutions compatible with ESP32 and STM32 development boards because these platforms support advanced debugging features unavailable on older Arduino Uno models.

Hardware tools often include:

  • USB-to-Serial adapters
  • Logic analyzers
  • JTAG interfaces
  • SWD probes

Arduino Uno debugging not supported is a common limitation because classic Uno boards lack native hardware debugging architecture.

Programming Debug Software

Software Used to Debug C++ Code and How Does Arduino IDE Support Debugging?

Arduino debugging software within Arduino IDE supports serial-based debugging and integrated breakpoint debugging on compatible boards. Arduino IDE 2.x introduced enhanced debugging capabilities for newer boards.

Key debugging functions include:

  • Variable inspection
  • Breakpoint control
  • Call stack viewing
  • Serial logging
  • Real-time monitoring

Basic Serial Debugging Example

void setup() {
  Serial.begin(9600);
}

void loop() {
  int sensorValue = analogRead(A0);
  Serial.println(sensorValue);
  delay(1000);
}

This method prints sensor readings directly to the Serial Monitor for troubleshooting.

Arduino IDE debug ESP32 workflows are especially popular because ESP32 supports integrated debugging through OpenOCD and GDB.

What Are the Limitations of Arduino Debugging Software?

Arduino debugging software capabilities vary by board architecture, memory size, and processor support.

Common limitations include:

  • Limited RAM for debug logging
  • No native breakpoints on older AVR boards
  • Restricted real-time inspection
  • Serial communication overhead
  • Incomplete debugging support in low-cost boards
BoardNative Debug Support
Arduino UnoNo
Arduino Uno R4Yes
ESP32Yes
STM32Yes

Arduino code debugger online tools exist, but most professional debugging still relies on local IDE environments and physical hardware connections.

How Can Developers Improve Arduino Debugging Accuracy?

Arduino debugging software becomes more effective when combined with structured testing practices.

Recommended practices include:

  • Use descriptive serial logs
  • Test one hardware module at a time
  • Validate power supply stability
  • Monitor memory consumption
  • Use version-controlled firmware

Related topics often discussed with Arduino debugging software include Arduino IDE, STM32 debugging software, ESP32 debugging tools, and software used to debug C++ code.

Conclusion

Arduino debugging software is evolving toward integrated real-time diagnostics, cloud-connected testing, and advanced hardware debugging support for IoT development. Modern boards such as ESP32, STM32, and Arduino Uno R4 now provide improved debugging frameworks compared to earlier AVR-based platforms.

Developers working with embedded systems can also benefit from understanding broader concepts such as approaches of debugging in software engineering for structured troubleshooting and validation strategies across software and hardware environments.

FAQ

What is Arduino debugging software?

Arduino debugging software is a set of tools used to identify and fix errors in Arduino code and connected hardware systems.

Does Arduino Uno support hardware debugging?

Classic Arduino Uno boards do not support native hardware debugging because the AVR architecture lacks integrated debugging hardware.

Which Arduino IDE version supports debugging?

Arduino IDE 2.x supports enhanced debugging features for compatible boards such as ESP32, STM32, and Arduino Uno R4.

Can ESP32 boards use Arduino debugging software?

Yes. ESP32 boards support advanced debugging through OpenOCD, GDB, and PlatformIO integrations.

Is Arduino debugging software free?

Most Arduino debugging software tools, including Arduino IDE and OpenOCD, are available as free downloads.

Sources

  • https://docs.arduino.cc/learn/microcontrollers/debugging/
  • https://www.arduino.cc/en/software
  • https://www.arduino.cc/pro/software-plc-ide
  • https://forum.arduino.cc/t/debugging-ide-2-3-2/1270808
  • https://docs.arduino.cc/tutorials/uno-r4-minima/debugger/
  • https://randomnerdtutorials.com/software-debugger-arduino-ide-serialdebug-library/
  • https://www.youtube.com/watch?v=V__84YSHvB4
  • https://forum.arduino.cc/t/simple-arduino-debugging-tool/363684
READ MORE
Uncategorized
Umesh Kumar KhiriMay 20, 2026 0 Comments
Share article:TwitterFacebookLinkedin
13 Views
1 Like

Approaches of Debugging in Software Engineering: 7 Powerful Methods Explained

Approaches of debugging in software engineering refer to structured techniques used to detect, analyze, and correct errors in software systems. Debugging is an essential activity in software development because it helps developers improve functionality, maintain system stability, and ensure accurate program execution. Effective debugging methods are widely used in web development, embedded systems, enterprise software, and mobile applications to reduce operational failures and improve software quality.

Key Takeaways

  • Approaches of debugging in software engineering help identify and resolve software defects systematically.
  • Common debugging methods include brute force, backtracking, and cause elimination.
  • Hardware and software debugging tools support enterprise, embedded, and mobile application development.
  • Testing detects defects, while debugging corrects them.
  • Effective debugging improves software reliability, maintainability, and system performance.

Software Debugging Techniques and Methods

What are the main approaches of debugging in software engineering?

Approaches of debugging in software engineering are commonly classified into several structured methods based on how developers identify and analyze defects.

The most widely used debugging approaches include:

  1. Brute Force Method
    • Uses logs, memory dumps, and print statements
    • Suitable for small applications and quick diagnostics
  2. Backtracking
    • Starts from the point where the error appears
    • Traces program execution backward to locate the fault
  3. Cause Elimination
    • Uses testing and hypothesis validation
    • Eliminates possible causes until the root issue is identified
  4. Program Slicing
    • Isolates relevant sections of code affecting a variable or output
    • Common in complex enterprise applications
  5. Static and Dynamic Debugging
    • Static debugging analyzes code without execution
    • Dynamic debugging analyzes runtime behavior
Debugging ApproachPrimary UseCommon Environment
Brute ForceQuick issue tracingSmall applications
BacktrackingLogic error detectionStructured programs
Cause EliminationRoot-cause analysisEnterprise systems
Program SlicingDependency analysisLarge codebases
Dynamic DebuggingRuntime monitoringWeb and mobile apps

Many developers also explore debugging tools in software engineering, debugging techniques in embedded systems, and debugging diagrams when learning advanced troubleshooting workflows.

Why are debugging methods important in software engineering?

Approaches of debugging in software engineering help reduce software failures, improve maintainability, and support software validation standards.

Key benefits include:

  • Faster identification of coding errors
  • Improved application reliability
  • Reduced downtime in production systems
  • Better software testing outcomes
  • Enhanced cybersecurity and stability

Industries such as healthcare, banking, aerospace, and automotive systems rely on structured debugging because software defects can affect compliance and operational safety.

Hardware and Software Debugging Tools

Which hardware and software debugging tools are commonly used?

Approaches of debugging in software engineering often depend on specialized debugging tools for code analysis and hardware communication.

Common software debugging tools include:

  • GDB (GNU Debugger) for C and C++
  • Visual Studio Debugger for enterprise applications
  • Chrome DevTools for JavaScript debugging
  • PyCharm Debugger for Python applications

Common hardware debugging tools include:

  • JTAG debugging systems
  • Oscilloscopes
  • Logic analyzers
  • Embedded system emulators

USB Debugging Software for Windows and PC

USB debugging software enables communication between Android devices and computers for testing and troubleshooting.

Typical uses include:

  • Android app testing
  • ADB command execution
  • Device log monitoring
  • Firmware diagnostics

Popular tools include Android SDK Platform Tools and Windows-based USB debugging utilities.

Software Used to Debug C++ and JavaScript Code

C++ and JavaScript applications require different debugging environments because of runtime and execution differences.

Examples include:

Programming LanguageCommon Debugging Tool
C++GDB, LLDB
JavaScriptChrome DevTools, Node Inspector
PythonPyCharm, pdb
JavaEclipse Debugger

Software Testing and Debugging Difference

What is the difference between software testing and debugging?

Approaches of debugging in software engineering differ from software testing because testing identifies defects, while debugging fixes them.

Testing and Debugging in Software Engineering

FactorTestingDebugging
PurposeDetect defectsFix defects
Performed ByTesters and QA teamsDevelopers
Process TypeValidation activityCorrection activity
OutputError reportsCorrected software

Testing verifies whether software meets requirements, while debugging identifies the exact source of failures.

How does debugging support software quality assurance?

Approaches of debugging in software engineering improve software quality assurance by reducing runtime failures and increasing code reliability.

Debugging supports:

  • Unit testing
  • Integration testing
  • System validation
  • Embedded system verification
  • Performance optimization

In embedded systems, debugging is especially important because hardware and software interactions can create timing-related or memory-related defects.

Conclusion

Approaches of debugging in software engineering provide structured methods for identifying, analyzing, and correcting software defects across modern development environments. Organizations increasingly combine debugging tools, testing frameworks, and runtime monitoring techniques to improve software reliability and maintain long-term system stability.

Modern development practices also integrate debugging with related workflows such as application development software with debugging to support faster deployment, maintenance, and quality assurance processes.

FAQ

What are the main approaches of debugging in software engineering?

The main approaches include brute force, backtracking, cause elimination, program slicing, and dynamic debugging.

What is debugging in programming?

Debugging is the process of identifying, analyzing, and correcting errors in software code.

Why is debugging important in software development?

Debugging improves software reliability, security, stability, and overall application performance.

What tools are used for debugging software?

Common tools include GDB, Visual Studio Debugger, Chrome DevTools, JTAG systems, and Android debugging utilities.

What is the difference between testing and debugging?

Testing identifies software defects, while debugging focuses on locating and fixing the root causes of those defects.

Sources

  • https://www.geeksforgeeks.org/software-engineering/software-engineering-debugging-approaches/
  • https://www.slideshare.net/slideshow/debugging-approachespptx/255506356
  • https://wearebrain.com/blog/10-effective-debugging-techniques-for-developers/
  • https://www.ranorex.com/blog/what-is-debugging-software-testing/
  • https://www.ibm.com/think/topics/debugging
  • https://www.studocu.com/in/messages/question/6469006/explain-different-debugging-approaches
  • https://medium.com/@imtiyaazkhan/what-is-debugging-what-are-the-different-debugging-approaches-in-software-development-2b35d465cdfa
  • https://www.tricentis.com/learn/debugging
  • https://www.expertsmind.com/questions/what-are-the-main-approaches-in-debugging-30195889.aspx
READ MORE
  • 1
  • 2
  • 3
  • 4
  • 5
  • …
  • 14

Recent Posts

  • Debugging Goals in Software Testing: 7 Powerful Benefits for Reliable Applications
  • Importance of Debugging in Software Development: 7 Powerful Benefits for Software Quality
  • What Is the Purpose of Debugging in Software Testing? 7 Powerful Benefits You Must Know
  • How to Debug Software: 7 Essential Methods for Finding and Fixing Errors
  • Debugging in Software Development Cycle: 7 Powerful Techniques for Error-Free Applications

Recent Comments

  1. Fred Hyman on Yellow Cap
  2. Fred Hyman on T-Shirt Full Hand
  3. Fred Hyman on Yellow Cap
  4. Randal Gray on Black T-Shirt
  5. John Harris on Black T-Shirt

Archives

  • June 2026
  • May 2026
  • April 2026
  • March 2026

Categories

  • AI in App Development
  • Uncategorized
Recent Posts
  • Debugging Goals in Software Testing: 7 Powerful Benefits for Reliable Applications
    Debugging Goals in Software Testing: 7 Powerful Benefits for Reliable Applications
    June 9, 2026
  • Importance of Debugging in Software Development: 7 Powerful Benefits for Software Quality
    Importance of Debugging in Software Development: 7 Powerful Benefits for Software Quality
    June 9, 2026
  • What Is the Purpose of Debugging in Software Testing? 7 Powerful Benefits You Must Know
    What Is the Purpose of Debugging in Software Testing? 7 Powerful Benefits You Must Know
    June 8, 2026
Categories
  • AI in App Development5
  • Uncategorized129
logotype

RCEENetworks LLC

1-844-284-3695

info@rceenetworks.com

3010 Lyndon B Johnson Fwy #1200, Dallas, TX 75234, United States

Menu

HomeServices

ProductsBlog

Contact

Other Links

RetinaWiseAI™Privacy PolicyContent PolicyTerms & Conditions

Social Links

TwitterFacebookInstagramLinkedin

Copyright © 2026 RCEENetworks LLC. All Rights Reserved